CATEGORIES:
BiologyChemistryConstructionCultureEcologyEconomyElectronicsFinanceGeographyHistoryInformaticsLawMathematicsMechanicsMedicineOtherPedagogyPhilosophyPhysicsPolicyPsychologySociologySportTourism
D. Simple Block Diagram Simulations
To test to see how this system responds, some values must be assumed for the mass, friction, and speed. SI units tend to work the best in this type of model, because they all convert well between each other. Assume that the car is 1400 kg (about 3000 lbs), the desired speed to resume to is 30 m/s (about 65 mph), and that friction b is 50 Nsec/m. To reach this speed, the engine needs to apply 1500 N of force. This situation can be tested in the following Simulink simulation (Figure 1):
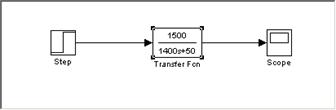
Fig. 1. Simple open loop cruise control block diagram.
The output of this simulation with a step input of 1 looks like this (Figure 2):
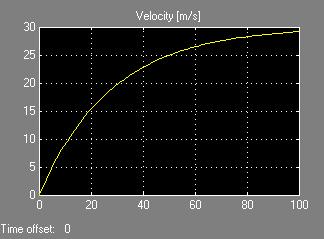
Fig. 2. Open loop cruise control system response.
This system is simple because it takes a step input of 1 and then just continues to grow until it reaches its maximum possible speed of 30 m/s. Clearly, this system needs much improving though, because no one would want a cruise control system that takes a few minutes to accelerate to 65 mph! A quick improvement that can be made is to add a harmony feedback loop (Figure 3):
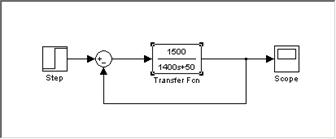
Fig. 3. Simple closed loop cruise control block diagram.
The output of this system is the following (Figure 4):
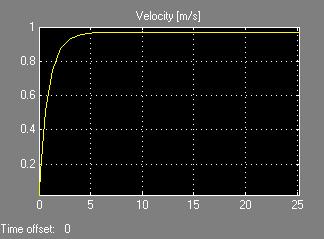
Fig. 4. Closed loop cruise control system response, step input of 1.
The feedback loop causes the output to try to equal the input of the initial step function. Since the step function was still set at 1 for this simulation, the output tries to go to 1 m/s instead of the desired 30 m/s. With a feedback loop, the input to the system must be equal to the desired output. This is basically saying that when the driver hits the resume button, the input to the system is the stored value for the speed that the cruise control had previously been set at. With the step function set at 30, the output is the following (Figure 5):
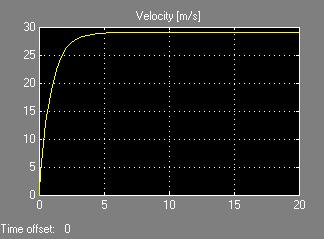
Fig. 5. Closed loop cruise control system response, step input of 30.
Clearly, the feedback loop works well in speeding up the response time. In fact, the 5 second response time is rather unrealistic for a car accelerating to 65 mph. This is partly due to the assumption that the engine is providing a constant 1500 N force; this is not a realistic assumption, because the amount of force the engine can provide will fluctuate up and down as the car accelerates, and a driver generally does not wish to make a car accelerate as fast as it can. A realistic target response time for accelerating to 65 mph is probably about 15 seconds under real world driving conditions (most cars can do so in under 10 seconds if held at full throttle, but full throttle acceleration is generally not ideal for real world driving conditions with surrounding traffic, nor for fuel economy). Another shortcoming of the feedback system is the steady state error—the car is actually only traveling at 29 m/s instead of the desired 30 m/s. The solution is to introduce a PID controller, which is just what most real cruise control systems utilize today.
Date: 2014-12-22; view: 1998
| <== previous page | | | next page ==> |
| C. The Physics Behind Cruise Control Systems | | | E. PID Controlled Cruise Control |