CATEGORIES:
BiologyChemistryConstructionCultureEcologyEconomyElectronicsFinanceGeographyHistoryInformaticsLawMathematicsMechanicsMedicineOtherPedagogyPhilosophyPhysicsPolicyPsychologySociologySportTourism
Table 1 – The organism consumption of energy during various kinds of activities.
| № | Kind of activity | Energy consumption, kcal/hour |
| Sleep | ||
| Personal hygiene, cooking and eating | ||
| Sitting rest | ||
| Tidying up at home | ||
| Reading and attending | ||
| Work on a computer | ||
| Standing conversation | ||
| Sitting conversation | ||
| Easy – tempered walk, to 4 km an hour | ||
| Driving | ||
| Different kinds of physical work depending on the intensity | 200 - 500 |
| № | Kind of activity | Duration, hour | Energy consumption, kcal | Total energy consumption, kcal |
| Sleep | ||||
| Morning toilet | ||||
| Breakfast | ||||
| Way to the work | ||||
| Total | 24 hours |
Table 3 –Compound and caloricity of food stuff
| Product | Compound % | Caloricity (calories/100 grams) | |||
| proteins and nitric substances | fats | carbohydrates | mineral salts | ||
| Low-fat beef | 20,5 | 2,0 | 1,2 | ||
| Fatty beef | 18,4 | 21,4 | 1,0 | ||
| Low-fat pork | 20,1 | 6,6 | - | 1,1 | |
| Fatty pork | 14,5 | 37,3 | - | 0,7 | |
| Mutton | 16,4 | 31,1 | 0,9 | ||
| Fowl | 19,8 | 5,1 | 1,1 | 1,1 | |
| Eggs | 12,5 | 12,1 | 0,7 | 1,1 | |
| Liver | 19,4 | 4,6 | 2,1 | 1,6 | |
| Brain | 9,0 | 9,3 | - | 1,1 | |
| Lard | 11,0 | 68,4 | - | 4,8 | |
| Sausage | 14,1 | 15,0 | 4,0 | 2,8 | |
| Boiled sausage | 12,8 | 13,7 | - | 3,3 | |
| Black spawn | 26,0 | 16,3 | - | 4,3 | |
| Carp | 20,4 | 1,5 | - | 1,3 | |
| Herring | 18,4 | 14,5 | - | 13,9 | |
| Fresh milk | 3,4 | 3,7 | 4,9 | 0,7 | |
| Condense milk | 10,5 | 10,1 | 51,0 | 2,0 | |
| Cream | 3,0 | 22,6 | 4,3 | 0,6 | |
| Sour cream | 4,3 | 26,2 | 1,7 | 0,5 | |
| Cheese | 25,8 | 31,5 | 2,4 | 6,1 | |
| Low-fat cheese | 14,6 | 0,6 | 1,2 | 1,2 | |
| Butter | 1,1 | 86,6 | 0,6 | 1,2 | |
| Semolina | 9,4 | 0,9 | 75,9 | 0,4 | |
| Buckwheat | 12,9 | 2,8 | 64,7 | 2,1 | |
| Rice | 8,1 | 1,3 | 75,5 | 1,0 | |
| Rye bread | 7,8 | 0,7 | 43,7 | 1,6 | |
| White bread | 6,8 | 0,5 | 57,8 | 0,9 | |
| Spaghetti | 10,9 | 0,6 | 75,5 | 0,6 | |
| Green peas | 25,8 | 3,8 | 53,0 | 2,9 | |
| Potatoes | 2,1 | 0,2 | 19,6 | 1,0 | |
| Carrot | 1,2 | 0,3 | 9,1 | 1,0 | |
| Cabbage | 1,8 | 0,2 | 5,0 | 1,2 | |
| Cucumbers | 1,1 | 0,1 | 2,2 | 0,5 | |
| Salad | 1,6 | 0,2 | 2,4 | 0,9 | |
| Tomatoes | 0,9 | 0,2 | 4,0 | 0,6 | |
| White mushrooms | 5,4 | 0,4 | 5,1 | 0,9 | |
| Apples | 0,4 | - | 12,1 | 0,4 | |
| Grapes | 1,0 | - | 15,2 | 0,5 | |
| Raisin(s) | 2,5 | 0,6 | 69,7 | 1,7 | |
| Apricots | 1,2 | - | 11,0 | 0,6 | |
| Oil | - | 99,5 | - | - | |
| Nuts | 13,8 | 48,2 | 10,7 | 1,4 | |
| Sugar | - | - | 99,5 | 0,4 | |
| Honey | - | - | 79,9 | 0,2 | |
| Chocolate | 22,2 | 22,2 | 63,4 | 2,3 |
Table 4 – A counting table of nutrition caloricity
| № | Products | Weight, gr | Caloricity | Contents, gr | |||
| 100 hr | Total | proteins | fats | carbohydrates | |||
Table 5 - Radioactive contamination of the products
| № | The name of product | Quantity kg. | Contamination 137Cs | Contamination 137Cs | ||
| (Bc/kg) | (Sum in total, Bc) | (Bc/kg) | (Sum in total, Bc) | |||
| Meat and meat prod. | ||||||
| Fish and fish products | ||||||
| Milk | ||||||
| Cheese | ||||||
| Sour-cream | ||||||
| Tough cheese | ||||||
| Eggs | 6/шт. | 2/шт. | ||||
| Butter | ||||||
| Oil | ||||||
| Sugar | ||||||
| Bread | ||||||
| Potatoes | ||||||
| Vegetables | ||||||
| Fresh fruits | ||||||
| Dried fruits | ||||||
| Water | ||||||
| Total |
Seminar 4. Main ecology laws and their connections with natural and social laws.
Purpose: Formation of scientific experience and realizing the necessity of obeying the basic laws of the nature in all kinds of human`s activities.
Task: Learn analyzing interconnections in natural and social phenomena and processes.
Seminar 5. World`s experience in solving ecological problems.
Purpose: Generalize the world`s experience of environment`s protection.
Task: Gather the whole information of this topic.
Seminar 6. The human is a creator. The role of creative work in the human`s life. Professional dangers, connected with the chosen speciality.
Purpose: Learn how to express your minds, to give reasons and to persist your opinions during discussions.
Task: Get acquainted with the main the main dangers, connected with professional creativity.
Seminar 7. The evaluation of dangerous and hazardous factors for human life.
Purpose: Realize the term Acceptable Risk; to identify, evaluate, and eliminate or control hazards so that the risks deriving from those hazards are acceptable.
Tasks: On grounds of a sociological approach to find out the statistical estimation of the evaluation of dangerous and hazardous factors for human life.
That premise is supported by this theory: If there are no hazards, if there is no potential for harm, risks of injury or damage cannot arise.
The term acceptable risk is becoming the norm. The more frequent use over time of the term acceptable risk in standards and guidelines is notable.
Students are offered 25 factors listed in Table 1 to assess the danger of life in Ukraine: the most dangerous factor (according to the student) – estimated at 25 points, and then – 24, 23, 22 and to the last, which is considered to be the least dangerous – at 1 point.
Clearly, having quite a different life experience, students in different ways evaluate the danger of a factor, so the obtained results should be statistically processed. For each factor one counts the number of points that he identified, this amount is divided by the number of surveyed students; the obtained value is an average rating of danger or another factor: the larger it is, the more dangerous factor is. The average score of every factor of danger is counted with help of this formula:
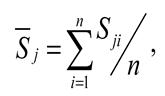
 -individual students’ rates for every factor;
n – the number of questioned students.
If we assume that the listed factors cover all the hazards to human life, we can assess the relative share (percentagewise) of each factor by total number of undesirable consequences with the help of the formula:
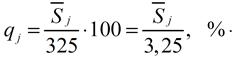
The results are to be tabulated.
Summarizing, it must be said that the accuracy of such an assessment increases with the number of respondents, and depends on profession, age and sex.
The forecast of the possible increase of a lifetime on condition that we eliminate certain causes of death, allows us to detect dangerous factors for our life. According to the forecast of scientists the eliminate of major cardiovascular and renal diseases will increase our lifetime by 10.9 years, heart disease – by 5.9 years, malignancies – by 2.3 years, accidents (except car accidents) – by 0.6 of a year, automobile accidents – by 0.6 of a year, infectious diseases – by 0.2 of a year, and T.B. – by 0.1 of a year .
Date: 2015-01-29; view: 3276
| <== previous page | | | next page ==> |
| Define the level of your self-assessment | | | Table 1 - The evaluation of dangerous and hazardous factors for human life |