
CATEGORIES:
BiologyChemistryConstructionCultureEcologyEconomyElectronicsFinanceGeographyHistoryInformaticsLawMathematicsMechanicsMedicineOtherPedagogyPhilosophyPhysicsPolicyPsychologySociologySportTourism
Coffee Mill Experimental Optimization
As a final example, consider the redesign of a coffee mill to reduce the noise generated during use (Hirschi, 1997). In survey responses, customers indicated that they found the sound produced by the Krups coffee chopper to be too loud, especially during the initial chopping action. Although some customers keyed off a reduction in grinding noise volume to determine when the grinding process was nearing completion, all customers also desired a quieter product. The basic need was for a coffee grinder that would be less likely to wake someone when used in the early morning. Because of this clear trend in customer preference, it was decided to investigate a low noise redesign for the Krups coffee chopper.
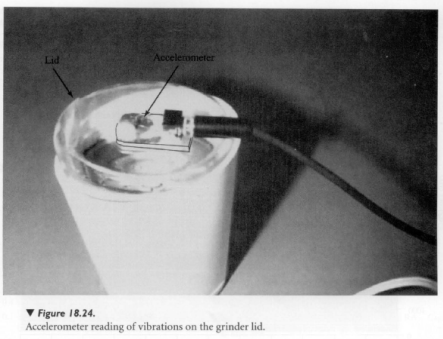
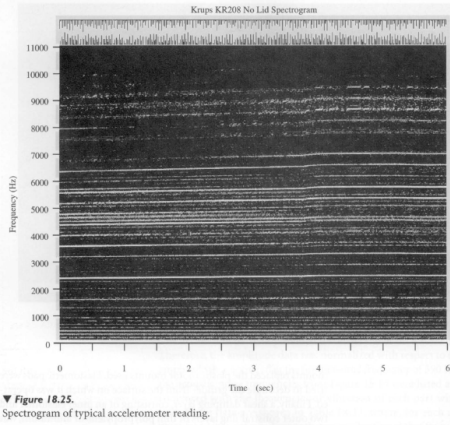
This was done by performing a set of designed experiments that would allow changes in design variables to be linked to measured changes in an output variable, namely the audible noise produced by grinder vibrations during operation. A first step was to investigate which parts in the mill were vibrating and then subsequently determine possible changes to these parts to reduce generated noise. Using an accelerometer, vibration data was recorded from various positions on the parts of the running coffee grinder as shown in Figure 18.24. The accelerometer signal was recorded and Fourier transformed into a spectrogram, a representation intensity of each vibration component, graphed with respect to time and frequency. A sample spectrogram from accelerometer readings when attached to the outer shell is shown in Figure 18.25.
The accelerometer data provided a voltage signal on a scale of ± 1 V. Therefore, the amplitude data was normalized with respect to the peak amplitude that occurred at the fundamental frequency of 390 Hz. Next, the acoustic noise frequencies from Figure 18.25 were listed and then compared with the frequencies of vibration of each part within the mill. These data are shown in Table 18.23, where, for each acoustic noise frequency recorded, parts that were vibrating at that frequency are listed. This provided an indication of which parts to attack to minimize the transmission and broadcasting of the acoustic noise.
Next, a set of experimental variables was devised, basically just modifications to the structure and construction of the original mill. Then, after building prototypes, audible noise recordings were made and analyzed for each experimental configuration. In this manner, the quantity and quality of noise produced by each experimental prototype could be determined and a statistical model developed. The best way to reduce the grinder's audible output was to incorporate sound-and vibration-absorbing materials into the redesigned product.
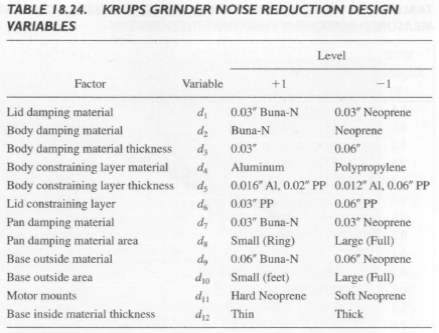
This included placing elastomeric damping layers between the stainless steel grinding chamber and the plastic shell and also between the base of the motor and the bottom plastic base plate. Elastomeric motor mounts replaced the plastic motor mounts used. Elastomeric pads were tried to decouple the grinder from the surface on which it was operated. Finally, a shear damping layer, consisting of an inner elastomer and two outer constraining layers of thin polypropylene or aluminum, was explored as a part of the grinder body. In theory, the elastic shear damping layer would create a viscous coupling between the polypropylene outer layer of the grinder's body and lid and thereby resist vibration deflections. The resulting design variables are shown in Table 18.24, along with the materials and dimensions used. Two different types of rubber, neoprene and Buna-N, were used because of their differing hardness and the appreciable difference in their vibration- damping characteristics. The neoprene was rated Shore A 35-45, while the Buna-N rubber was rated 45-55. Motor mounts, constructed of neoprene in all cases, were rated either Shore A 5-10 for the "soft" design or 65-75 for the more rigid design. Rather than just trying two different thickness' of plastic for the shear damping layer inside the shell, two different materials, aluminum and polypropylene, were selected to explore how the material's stiffness would factor into its shear damping characteristics. All proto typing materials and grinder parts were adhered together with a clear silicon adhesive, selected because of its ability to bond both plastic and metal and also because it formed a firm yet flexible bond that would allow the shear-damping effect to occur.
Once the important design variables had been selected, an experimental matrix was developed. With 12 variables, each having two possible values, it was obvious that a full-factorial set of 212 experiments including all possible permutations would be excessive and wasteful.
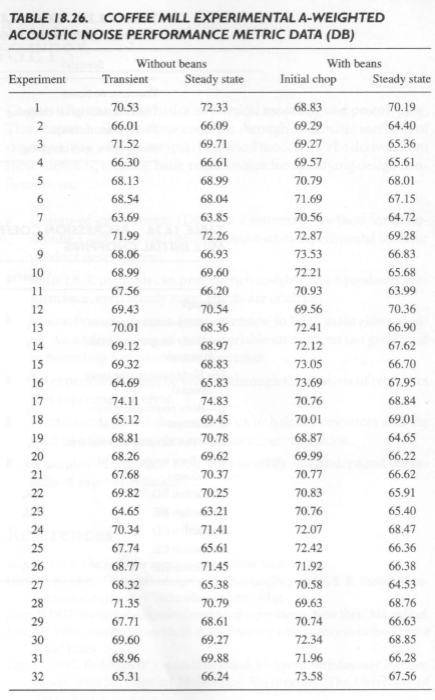
Time and resources permitted 16 grinders to be purchased. This made 16 grinders available for experiments, thereby making exactly 16 ways to combine all the damping and constraining layer possibilities for the body of the grinder. Also, however, the swapping of various easily interchangeable parts such as the lid further increased the number of experiments that could be conducted with 16 grinders. The final experimental matrix, derived from Table BA in Appendix B, is shown in Table 18.26, with 32 different experimental configurations. The partial factorial design forced confounded variables. In order to ensure this did not pose a problem, variables whose interactions were confounded were chosen such that they physically could not directly interact. For example, the lid-damping material would have little interaction with the rubber feet, and so the lid material was selected as variable A and foot pad material as variable B. Since their interaction effect would be negligible, the fact that their interaction effect AB could not be isolated from variable G in this experimental design is irrelevant.

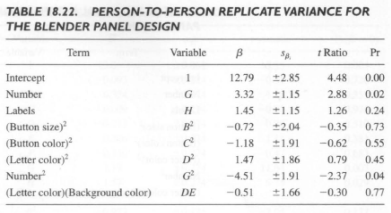
After developing the experimental array and variables, experimental prototypes were constructed as shown in Figure 18.26. Each experimental configuration was recorded for a full operational cycle both with and without beans in the grinding chamber. Replicates were deemed not necessary, since it was clear the sound recordings were identical trial to trial (sT is very small). The operational cycle consisted of turning the grinder on and letting it operate until the beans were completely ground, which ordinarily took about 12 sec. Ordinary store-bought beans were used for these experiments. During operation, the lid of the mill was gently depressed in order to keep it from flying off and also to keep the torque generated by the motor from moving the grinder around on the lab bench. However, care was taken not to allow anything to touch the side walls of the grinder body or to get between the grinder and the sound level meter and microphone, so as not to effect the experimental results.
This process was repeated for each of the 32 prototype models, yielding a total of 64 grinder noise
recordings. In addition, recordings were also made of the unmodified mill, both with and without
beans.
After the experimental data had been collected, the analysis process began. Each noise signal recording was split into transient and steady-state segments and Fourier transformed into frequency components. Figure 18.25 shows a typical spectrogram. Using the spectrogram as a guide, the transient segment of the grinders noise output was judged to occur from the onset of grinding to the point where the motor frequency reached about 90% of its steady-state value of approximately 390 Hz. Generally, this consisted of 1.5-2 sec of recorded material, which was then clipped and separately analyzed as a transient response. Steady-state material was considered to be any sound produced by the grinder from the point at which the motor reached 98% of its full operational speed to just before the conclusion of grinding. This too was clipped and analyzed.
An important step in the analysis was achieving proper weighting by frequency. That is, the human ear has a nonlinear frequency response. If a test tone of constant amplitude were swept up from the lowest humanly perceivable frequency, about 20 Hz, to the highest, near 20 kHz, its perceived loudness would change with respect to frequency, even though the actual volume of the tone remained constant during the test. The human ear is insensitive to low frequencies, exhibiting a roll off in response of about 20 dB/decade starting at about 1 kHz. On the other hand, the human ear is sensitive to frequencies in the 2-10-kHz range, which correspond to the components of speech that are most critical for speech comprehension, such as sibilants and the overtones that differentiate one vowel from another. To solve this frequency perception problem, engineers have developed weighting filters that simulate the sensitivity of the human ear, among other things.
Various filters have been developed and given letter designations, as shown in Figure 18.27. The A-weighting filter approximates the frequency response of the human ear, and its sound pressure level response has been shown to correlate well with human-perceived differences in loudness.
Since the A-weighted response was an important factor for gauging the human perception of the grinder's loudness, all recordings of the grinder were modulated with the A-weighting filter. A typical A-weighted noise spectrum of the mill from an experimental trial is shown in Figure 18.28.
The next step was to convert each of the power spectrums into a single noise rating, by integrating the A-weighted noise amplitudes over the frequencies

where A(w) is the A-weighted amplitude at frequency w. The result is average amplitude on a decibel scale. This basically involves integrating the area under the curve in Figure 18.28, which provides a single number that can be statistically fit to the experimental arrangements as shown in Table 18.26. There are four sets of data shown, discriminated by the noise generated with and without beans in the grinder and the noise generated during the initial transient stage versus the latter stages of grinding when the motor no longer accelerates. The initial stage is generally louder due to the beans being greatly reduced in size.
The unmodified coffee mill had A-weighted decibel readings of 82 dB with beans and 71 dB when operated without beans, at steady state. The experimental data ranged from about 65 to 75 dB. Recall every 10 dB increase represents a doubling of acoustic noise, so a 10 dB decrease in acoustic noise is a substantial and noticeable 50% noise reduction. Experimental analysis was made on the experimental data of Table 18.26. The correlation coefficient of the main effect model for each output is shown in Table 18.27 and are not particularly great for any of the outputs.


Given these weak results with the main effect model, next higher order models were explored. Interaction terms were expected, since some of the variables represented stiffeners and some of the design variables represented absorbers, and these should work in concert. Trying fits of different interaction effects, a reasonable model was developed of the transient noise with beans as shown in Table 18.28. The regression equation was:

which fit to a correlation coefficient of 0.75, and the standard error of the residual was ±0.72 dB. This was not the greatest fit, but it was not that bad either.
Using this model, a configuration that minimized noise was determined and constructed. This redesigned mill had a generated acoustic noise of 68 dB on an equivalent A-weighted scale, compared with 82 dB of the original design. This represents 14 dB or well over a 50% reduction in acoustic noise.




V. SUMMARY AND "GOLDEN NUGGETS"
Chapter 17 presents the basics of physical modeling and prototyping. This chapter builds on these concepts through systematic methods of experimenting with prototypes. Empirical models may be derived from these methods, creating basic relationships for specifying design configurations.
• Design-of-experiments (DOE) is a systematic method for determining a sufficient and comprehensive set of experimental trials for product development.
• Basic DOE methods can provide rich insights into a product's performance, even if only main effects are analyzed.
• Interaction effects are a direct extension to DOE main effect models. An understanding of design-variable interactions can greatly aid in bounding a product's configuration.
• All experiments must be verified through the analysis of replicates and experimental error.
• Fractional-factorial designs help us to balance resources and the level of information obtained from experimentation.
• A number of statistical tools exist to verify and understand the results of experimentation.
Date: 2016-01-14; view: 1592
| <== previous page | | | next page ==> |
| IV. PRODUCT APPLICATIONS OF PHYSICAL MODELING AND DOE | | | Arbeitszeit etwa 7 Minuten. |