CATEGORIES:
BiologyChemistryConstructionCultureEcologyEconomyElectronicsFinanceGeographyHistoryInformaticsLawMathematicsMechanicsMedicineOtherPedagogyPhilosophyPhysicsPolicyPsychologySociologySportTourism
Volgin Yaroslav 1er IB
What is the effect of different concentration of hydrogen peroxide (H2O2) on the activity of catalase?
Volgin Yaroslav 1er IB
Research Question:What is the effect of different concentration of hydrogen peroxide (H2O2) on the activity of catalase?
Introduction:At first, let’s take a look on the most important protein without which, life as we know it would not be possible. It is Enzymes.
Enzymes-Enzymes are a special kind of protein that cans catalase reactions in living organisms. These proteins are very long chain molecules which are build up by the amino acids building blocks and which have a three dimensional shape.
During metabolism a big amount of chemical reactions, including the enzymatic reaction as well, are occur in the body which are necessary in order to maintain the life of it.
Catalase is and biological enzyme that increase the rate of the splitting of hydrogen peroxide into water (H2O) and oxygen gas (O2) and lower the energy level needed to start the reaction.
The formula of the catalase reaction
2H2O 2H2O+O2
But the rate of this reaction can be different. It depended of the factor influences on the enzyme which are following 
The effect of increasing temperature on the rate of an enzyme catalyzed reaction.
During the reaction, substrate and enzyme are in movement and the factor which can influences on the rate of this movement is the temperature of fluid. All reaction in the organism does not matter with or without enzyme-will increase their rate of the reaction as temperature of the fluid increases. But the increasing of the rate will not continuous forever as temperature increases, in some level of the temperature (on the e.g. above it is in the region of 300C) enzyme will start to lose it shape and the rate of the reaction will decrease rapidly.

The effect of pH on the rate of an enzyme catalyzed reaction.
Changes in pH lead to the breaking of the bonds that hold the tertiary structure of the enzyme and which lead to the denaturation of the enzyme, so, enzyme will change its shape including the active side. Other words, when the spending on the amino acids change, hydrogen bonding in the protein molecule (enzyme) change and the molecule changes it shape and the new shape may not be effective.

The effect of substrate concentration on the rate of an enzyme catalyzed reaction.
The increasing of the concentration of substrate, as it is clear shown on the diagram, will lead to the increasing of the rate of reaction, but, as with the other factors, the increasing of the rate of reaction will not occur forever as the concentration of substrate increase. The rate will increase until it achieves the “Max rate” and when enzyme will work as fast as possible.
Procedure
In order to answer on the main question of this Essay, we have done one procedure to explore the effect of different concentration of hydrogen peroxide on the activity of catalase using potato with almost the same surface area and different concentration of H2O2.
Using materials
· Gas pressure sensor
· Magnetic Stirrer
· Pipette
· Beaker
· Laptop
· Logger pro program
·
· Hydrogen peroxide (0%,1%, 2%, 3%, 4%, 5%)
· Knife
· Sensitive scale
· Distill water
· Potato
Here is the table in order to show the variables, their description and especially, what was the method of the measuring of each of variables.
| Variables | Description | Method of Measuring |
| Independent | Hydrogen Peroxide(H2O2) | We used different concentration of Hydrogen Peroxide f rom (0%, 1%, 2%, 3%, 4%, and 5%) and we also used water. And every time we increased the amount of the H2O in the beaker until there was only Hydrogen Peroxide. But there was always just 50 ml of fluid |
| Dependent | The rate of the reaction(formula) r=( Pressure ÷Time)/kPa•s-1 | We used gas pressure sensor for the measuring of the rate of the reaction which always changed if there was in pressure, all the time. The sensor was always keeping very carefully without any shake. |
| Controlled | Temperature | Whole experiment was done in the one room with the same room temperature. |
| Recording of the data about the rate of the reaction | For every part of the experiment in the settlement of the rate were given the same amount of time and sensor was put immediately when potato was put in the beaker. | |
| Hydrogen Peroxide | Every time, we used another peace of potato but with the same volume and surface area | |
| Amount of the fluid in pipette | All pipette were with the marking and every time the amount of fluid in the beaker does not exceed 50 ml |
Hypothesis
During the procedure, two factors which can influence on the rate of the reaction, such as Temperature and pH, were controlled to be unchangeable and only substrate concentration increased with each experiment. So, this procedure has to show clear just the influence of the substrate concentration on the rate of the reaction and we predict that graph of the each experiment would be like this

Data Processing
| Hydrogen Peroxide Concentration, cl% | Rate of reaction, r/k Pa s-1 | ||||
| Trials | Mean(a) | Mean(b) | |||
| 0.003848 | 0.01500 | 0.01107 | 0.009973 | 0.011152 | |
| 0.02096 | 0.01848 | 0.01070 | 0.016713 | 0.01026 | |
| 0.02775 | 0.01636 | 0.01192 | 0.018677 | 0.01139 | |
| 0.02227 | 0.01819 | 0.01497 | 0.018477 | 0.01328 | |
| 0.03161 | 0.01833 | 0.02508 | 0.025007 | 0.01328 |
Calculation
· Rate of the reaction= Preasure/Time
· Mean(A)=(Trial 1+Trial 2 +Trial 3)/3
· Mean(b)=max Trial-min Trial
· Pres=mt+b
m-Slope of the curve.
Conclusion
This graph shows the average of each meaning in the table, this allow us to look in common how the experiment was done and “What is the effect of different concentration of hydrogen peroxide (H2O2) on the activity of catalase?”

Now it is possible to compare this graph with the graph, of the perfect influence on the rate of the reaction by the substrate concentration which was provided in the hypothesis. On this graph we can’t exactly see the point of the saturation and thus-we can’t exactly see where the enzyme is working with its maximum rate. At the start of this graph, the results are accurate and thus the graph at the beginning is accurate as well but than, maybe because of the limitations of the work has done the results became inaccurate and the graph is not perfect as in the sample of the perfect graph in the introduction because at the point 4 on X, graph decrease and them again increase rapidly.
Evaluation
| Limitation | Improvements |
| Because of the thing, that we had to put the pressure sensor manually in the tube and every time the rate of this action depended on the rate of human reaction and every time the human reaction was not the same, so, it could make inaccurate initial rate | More modern apparatus has to be used in order to avoid such errors. Because the pressure has to be measured as soon as hits the surface of hydrogen peroxide. |
| Every time we tried to use a certain shape of the piece of potato but every new piece we cut manually which of course lead to the errors in the certainty of the pieces. | We can use some technology which can cut identically certain pieces with the same surface area. In order to avoid errors and uncertainty on the results. |
| Some graphs had no time to continue after the point of saturation and we don’t even know how this graph would continue and will it continue as a normal graph of the effect of substrate concentration on the rate of the reaction or not. | We should do each experiment longer, until the graph reaches the point of saturation and more in order to see that it would continue as we predicted. |
| We were doing this experiment during some days and on every day the environmental and thus the temperature of the room was different and this could influence on the rate as well and at the end we would get Inaccurate results. | We should spend much time in one day and do this experiment in the same room and in the same day. |
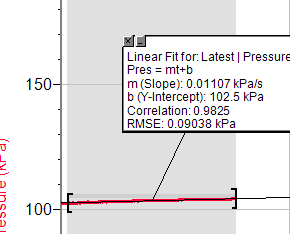
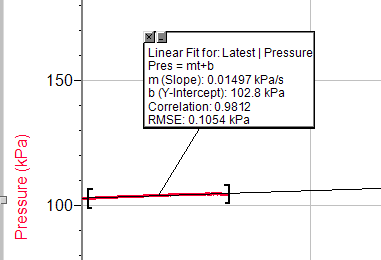
Appendix
Trial 3, concentration 1
Trial 3, concentration 2

Trial 3, concentration 3

Trial 3, concentration 4
Trial 3, concentration 5

Trial 1, concentration 1

Trial 1, concentration 2

Trial 1, concentration 3

Trial 1, concentration 4

Trial 1, concentration 5

Trial 2, concentration 1
Trial 2, concentration 2

Trial 2, concentration 3

Trial 2, concentration 4

Trial 2, concentration 5
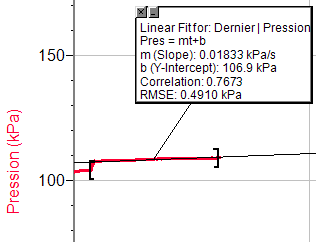
So, this data shows the result of each experiment.
Date: 2015-12-24; view: 9075
| <== previous page | | | next page ==> |
| Literacko-Plastycznego | | | Entstehungsgeschichte |