CATEGORIES:
BiologyChemistryConstructionCultureEcologyEconomyElectronicsFinanceGeographyHistoryInformaticsLawMathematicsMechanicsMedicineOtherPedagogyPhilosophyPhysicsPolicyPsychologySociologySportTourism
Creating a Plot Using Physical Test Data
1) On the Reviewmenu, select Postprocessingor press F8.
ADAMS/View launches ADAMS/PostProcessor (see Figure 4.5), a post-processing tool that lets you view the results of simulations you performed.
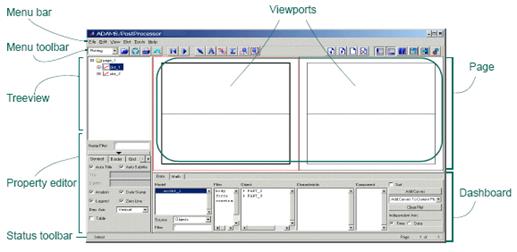
Figure 4.5 ADAMS/PostProcessor
2) At the bottom left of the dashboard, set Sourceto Measures.
3) From the Simulationlist, select test_dat.
4) At the bottom right of the dashboard, set Independent Axisto Data.
A browser, named Independent Axis Browser, appears. It lets you select data for the horizontal axis.
5) Select MEA_1.
6) Select OK.
7) From the dashboard, from the Measurelist, select MEA_2, for the vertical axis data.
8) Select Add Curvesto add the new data to the plot.
ADAMS displays the plot of the two measures as shown next:
Modifying Your Plot Layout
1) From the treeview, double-click page_1. Select plot_1. In the Titletext box, enter Latch Force vs. Handle Angle. Press Enter.
2) From the treeview, double-click plot_1, select haxis. In the Labeltext box, enter Degrees, and then press Enter.
3) Repeat the procedure for vaxis, labeling it Newtons.
4) From the treeview, select curve_1. In the Legendtext box, enter Physical Test Data.
Your plot should look similar to the one shown next:
Creating a Plot Using Virtual Test Data
1) In the dashboard, from the Simulationlist, select Last_Run (...).
2) Set Independent Axisto Data. The Independent Axis Browser appears.
3) Select overcenter_angle, for the horizontal axis data. Select OK.
4) From the Measurelist, select SPRING_1_MEA_1, for the vertical axis data.
5) Select Add Curves.
6) Change the legend text for this curve to Virtual Test Data.
7) From the Filemenu, select Close Plot Window.
Saving Your Model
From the Filemenu, select Save Database As,and then save the file as validate.
Date: 2015-12-18; view: 1057
| <== previous page | | | next page ==> |
| Creating a Handle Force | | | Simulating the Motion of Your Model |