CATEGORIES:
BiologyChemistryConstructionCultureEcologyEconomyElectronicsFinanceGeographyHistoryInformaticsLawMathematicsMechanicsMedicineOtherPedagogyPhilosophyPhysicsPolicyPsychologySociologySportTourism
and risk warnings, and advice to
avoid them:
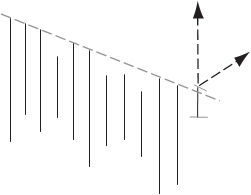
The market has formed on daily charts a specific formation, which I call a comb. (This is a sort of short-term trend seen on frame charts any time including intraday, daily, and weekly.)
USD/CHF, USD/JPY, EUR/USD, EUR/JPY and other Euro crosses.
Basic (conservative).
Take a position in the direction of the move on the break of the trendline limiting a comb from one side:
A. Buyon the break of the descending line, OR B. Sellon the break of the ascending line.
Any time.
Entry-stop order.
On the opposite side of the current day range. (Above the previous day high or below the previous day low.)
Recommended. (Automatic and simultaneous with stops.)
Average daily range (P1)End of the day (P2)Other
N/A
Average to High
Average to Low
Positive
The position was open in the The position was open in the direction direction of the medium-term of the main move of the previous day. trend.
RW#1:The position was open A#1:Move your stops closer and against the direction of the place them above (below) the previous medium-term trend. local extreme formed the same day. RW#2:The position was open A#2:Same as above.
against the main move of the previous day.
 P1
P1
P2
Buy
Stop
 FIGURE 20.1a
Stop
Sell
P2
P1

 FIGURE 20.1b

| Brief situation description: | The market has formed on intraday charts a comb formation. | ||
| Currency recommended for a trade: | USD/CHF, USD/JPY and some EUR crosses. | ||
| Trade characteristics: | Optional (risky). | ||
| Trade (entry point) suggestions: | Enter the market on the break of the line. | ||
| Entry time: | Any time. | ||
| Entry execution: | Entry-stop order. | ||
| Stop loss placed: | The opposite side of the day range | The nearest technical level | Other |
| Reverse if stops triggered: | Recommended. | ||
| Target (depends on the time frame): | End of the day (P1) | Average daily range (P2) | Other |
| Potential profit estimation: | N/A | ||
| Profit probability evaluation: | Average | ||
| Risks evaluation: | Average | ||
| P/L ratio: | Neutral | ||
| Potential advantages in favor of the open position: | A.The position was open in the direction of the main move of the day. B.The break of the line occurred simultaneously with forming of the new low or new high of the day. | ||
| Possible complications, disadvantages, and risk warnings, and solutions to avoid them: | N/A | ||
| Additional notices, recommendations, and trading tips: | To trade combs on an intraday basis is a bit problematic. It is better to trade having some other technical reasons to enter a position, because trading in limited time and space is always difficult for a trader. However, sometimes it works extremely well if you take profit at the right time. |
P2
 P1
P1
Buy
Stop
 FIGURE 20.2a
Stop
Sell
P1
 P2
P2
 FIGURE 20.2b
| Brief situation description: | A flat surface is formed on daily charts. | |||
| Currency recommended for a trade: | All majors and crosses. | |||
| Trade characteristics: | Optional. | |||
| Trade (entry point) suggestions: | Enter the market on the break of the surface. | |||
| Entry time: | Any time. | |||
| Entry execution: | Entry-stop order. | |||
| Stop loss placed: | The opposite side of the day range | Other technical level | ||
| Reverse if stops triggered: | Possible. | |||
| Target: | End of the day (P1) | Average daily range (P2) | Other | |
| Potential profit estimation: | N/A | |||
| Profit probability evaluation: | Average | |||
| Risks evaluation: | Average | |||
| P/L ratio: | Neutral | |||
| Potential advantages in favor of the open position: | N/A | |||
| Possible complications, disadvantages, and risk warnings, and solutions to avoid them: | N/A | |||
| Additional notices, recommendations, and trading tips: | Better when a position is open in the direction of the current medium-term trend. Also, some other reasons should support the idea of such a trade. However, if you trade on an intraday basis, the chance to make profit is quite acceptable. Can also be used for adding a position to another, profitable one. | |||
 Average daily range
P2
P1
Buy
Stop
 FIGURE 20.3a
Stop
Sell
Average daily
range P2
P1

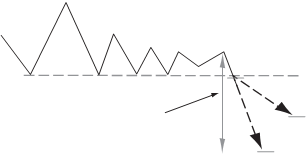 FIGURE 20.3b
| Brief situation description: | A flat surface is formed on intraday charts. | |||
| Currency recommended for a trade: | All majors and crosses. | |||
| Trade characteristics: | Basic. | |||
| Trade (entry point) suggestions: | Enter the market on the break of the formation. | |||
| Entry time: | Any time. | |||
| Entry execution: | Entry-stop order. | |||
| Stop loss placed: | The opposite side of the day range. | Other technical level. | ||
| Reverse if stops triggered: | Recommended. | |||
| Target: | End of the day (P1) | Average daily range (P2) | Other | |
| Potential profit estimation: | N/A | |||
| Profit probability evaluation: | Average | |||
| Risks evaluation: | Average | |||
| P/L ratio: | Neutral | |||
| Potential advantages in favor of the open position: | N/A | |||
| Possible complications, disadvantages, and risk warnings, and solutions to avoid them: | N/A | |||
| Additional notices, recommendations, and trading tips: | Better when a position is open in the direction of the current move. Usually supports the view that the move in this direction will happen during the day. If you trade on an intraday basis, the chance to make profit is quite acceptable. Can also be used for adding a position to another, profitable one. | |||
Stop
Sell
Average daily
range P2
 P1
P1
 FIGURE 20.4a
 P1
P1
Average daily
range P2
Buy
Stop
 FIGURE 20.4b
| Brief situation description: | The market approaches the major trendline drawn through two (or more) absolutely extreme points. (There should be the whole chart on one side from such a line and a totally free space on the other side.) The trade can be executed only on the approach to a supportive line of the uptrend or at the resisting line of a downtrend. | ||
| Currency recommended for a trade: | All majors and crosses. | ||
| Trade characteristics: | Basic. | ||
| Trade (entry point) suggestions: | Enter the market 5 to 10 pips before the line in the direction, opposite to the direction of the move. | ||
| Entry time: | Any time. | ||
| Entry execution: | Limit or market order. | ||
| Stop loss placed: | Behind the line. | ||
| Reverse if stops triggered: | Recommended. (Trailing stop can also be used.) | ||
| Target: | End of the day (P1) | Average daily range (P2) | Other technical point or reason |
| Potential profit estimation: | N/A | ||
| Profit probability evaluation: | Above average | ||
| Risks evaluation: | Below average | ||
| P/L ratio: | Positive | ||
| Potential advantages in favor of the open position: | N/A | ||
| Possible complications, disadvantages, and risk warnings, and solutions to avoid them: | N/A | ||
| Additional notices, recommendations, and trading tips: | The bigger the number of points lying on such a line, the less the probability to commit a profitable trade. I prefer to trade this template on the third or (at the maximum) fourth approach to the line. In the case of the fourth approach, I usually take profit early, using some market’s hesitation ahead of the line. |
Average daily range
P2
 P1
P1
Buy
Stop
 FIGURE 20.5a
Stop
Sell
 Average
daily P1 range
P2

 FIGURE 20.5b
| Brief situation description: | The market breaks the major trendline drawn through three or more absolutely extreme points. (There should be the whole chart on one side from such a line and a totally free space on the other side.) The trade can be executed only on the approach to a supportive line of the uptrend or at the resisting line of a downtrend. | |||
| Currency recommended for a trade: | All majors and crosses. | |||
| Trade characteristics: | Basic. | |||
| Trade (entry point) suggestions: | Enter the market 5 to 10 pips at the break of the line in the direction of the move. | |||
| Entry time: | Any time. | |||
| Entry execution: | Entry-stop order. | |||
| Stop loss placed: | The opposite side of the day range | Other technical level | ||
| Reverse if stops triggered: | Recommended. (Trailing stops can be used also.) | |||
| Target: | End of the day (P1) | Average daily range (P2) | Other technical point | |
| Potential profit estimation: | N/A | |||
| Profit probability evaluation: | Above average | |||
| Risks evaluation: | Below average | |||
| P/L ratio: | Positive | |||
| Potential advantages in favor of the open position: | N/A | |||
| Possible complications, disadvantages, and risk warnings, and solutions to avoid them: | N/A | |||
| Additional notices, recommendations, and trading tips: | The bigger the number of points lying on such a line, the less the probability to commit a profitable trade. I prefer to trade this template on the fourth or larger approach to the line. The position can also be turned into a longer-term positional trade, because the break of such a line indicates the possibility of a trend change. | |||
Stop
Sell
P1
Average
daily P2
range
 FIGURE 20.6a
 Average daily
range P2
P1
Buy
Stop
FIGURE 20.6b
| Brief situation description: | There is a CB intervention to support an undervalued currency in progress. | |||
| Currency recommended for a trade: | The undervalued currency and all its crosses. | |||
| Trade characteristics: | Trade of opportunity. | |||
| Trade (entry point) suggestions: | Enter the market on the run in the direction of the move using entry stops. | |||
| Entry time: | Any time. | |||
| Entry execution: | Entry-stop order. | |||
| Stop loss placed: | The opposite side of the day range | Other technical level | ||
| Reverse if stops triggered: | Not recommended. | |||
| Target: | End of the day (P1) | Other technical point (P2) | 100–300 pips (P3) | |
| Potential profit estimation: | 100 pips and up | |||
| Profit probability evaluation: | Very high | |||
| Risks evaluation: | Very low | |||
| P/L ratio: | Positive | |||
| Potential advantages in favor of the open position: | N/A | |||
| Possible complications, disadvantages, and risk warnings, and solutions to avoid them: | N/A | |||
| Additional notices, recommendations, and trading tips: | The intervention always takes place in support of an undervalued currency. Because it always goes against the trend and the most current move in exchange rates, it would be logical to start a trade by placing entry stops above the current day high as soon as the market price moves down 50 to 60 pips from it. Then, on the way down, a trailing stop can be used. It has to trail the market 60 to 100 pips above the most current low. After the intervention has begun and is confirmed, a trailing stop can be used to assure the profit and protect from unexpected losses. | |||
 P3 (100–300 pips)
Resistance
P2
Open
Entry P1 stop
Buy
Stop
FIGURE 20.7a
CHAPTER 21
A Sample Trade

|
trading profile and preferences.
On the chart, the market has formed a narrow horizontal channel at the beginning of a trading day and during the Asian session. Then, it broke the upper border of the channel, creating the opportunity to use Box 19.2 and to enter the market in the direction of the break for a quick and rela- tively moderate profit. For a more conservative trader who did not want the risk of entering the market with the position where the profit should be taken fast, there was another opportunity to enter the market. In accor- dance with another trading scheme (see Box 18.3), you can enter the mar- ket because it was moving in just one direction from the open price. If this trading opportunity was also considered an inappropriate one at the mo- ment, another trading opportunity would arise soon. Entering the market on the break of the low of the previous range was recommended in accor- dance with four (!) other different templates, Box 19.1, Box 18.2, Box 20.4, and even Box 18.1.

FIGURE 21.1
Then, the journey began, confirming several other thoughts and ideas described in the book.
First of all, on the way down, the market has formed at least three flat bottoms, and each of them was a clue for a trader that the move in this di- rection most likely would continue.
Second, as you can see, the idea of never opening a position against the main move of the day has also been confirmed, because the bottom pickers most likely were wiped out from the market by its powerful move. Because no major support or trendline was on the market’s way during this day, a trade against the main move of the day would never pay off. It is important to remember that under similar circumstances it is usually very difficult (even close to impossible) to choose the right moment when the market may turn to the opposite direction. If you missed all the previous trading signals and opportunities, it would be better to stay away from the market, waiting for another trading day, than to take chances on picking a bottom without having a trading signal in favor of such an attempt.
Third, it is not really important where a position was entered and profit was actually taken. In any case, if during that day the trading strat- egy has been chosen in accordance with one or another template, the profit was unavoidable and would have ranged from 70 to 80 pips and up
A Sample Trade 209
to a couple of hundred pips. However, the real importance of the example is the fact that this particular trading day can be considered as typical for the market. Its behavioral pattern was a common one and seen frequently (with some unimportant variations, of course). Using the templates pro- vides a perfect opportunity to trade with no stress, and without the neces- sity of predicting the future or making forecasts in advance. A simple reaction in accordance with trading signals and basic techniques de- scribed in trading templates would do the job perfectly and would give a trader a great advantage against any other way of trading.
Index
 Account size, requirements for, 16–17
Amplitude of day range, profit taking based on, 128–129
Ascending channel, 84–86
Ascending trendline, 77–83
Asian trading session, opening position during, 122
Attitude toward market, philosophical conception of, 30–31
Automatic order execution, 120
Automatic position entry, 120
Average daily trading range templates,
148–157
Averaging trading techniques, 99–101
Bank of Japan (BoJ), 141
Barings Bank, 101
Behavior of the market. See Market behavior
Black and gray boxes, 40
Break of trendline, 79. See also False break
good move after, 80 no, 79–80
Bridge/CRB, 4
Broker company vs. Bucket shop, 21
Bucket shops, 20–22
Buy ahead of a support and Sell ahead of a resistance, 118
“Buy low, sell high” formula, 62–64
Capital: reserve, 99 trading, 8–11
Central Bank (CB):
trading strategy and intervention of,
141–144
undervalued currency and intervention of, 204–205
Channel:
ascending, 84–86 descending, 84–86 horizontal, 87, 164–169 inclined, 170–175
Chart:
bearish divergence of, 60–61
Japanese candlesticks, 48–49 point and figure, 48–49
Client abuse, 20
Closing price, 64–66
Comb formation, 160–163, 191,
194–195
on daily chart, 192–193
on USD/DEM daily chart, 73–74
Commissions for transaction, 18–19
Common sense trading technique, 51,
Contract size, 9–10, 16, 130–131
Currency:
choosing a pair to trade, 95–96 daily trading range and, 56–67 oscillation of, 8
undervalued, 204–205
Current intermediate-term trend, 68
Current longer-term trends, 67
Cycles, in market activity, 135–140
Daily chart:
analysis of, 72
comb formation on, 192–193
flat surface formation on, 196–197 gaps on, 72–73
USD/DEM, comb formation on,
73–74
Daily trading range, 56–58 average, templates for, 148–157
Data feed, 4
Dealer-customer relationships, 20
Dealers choice:
bucket shops and, 20–22 commission payment in, 18–19 contract size in, 16
margin value and leverage in,
15–16
on-line trading opportunity in, 18 operation account size in, 16–17 recent industry developments and,
22–23
spread size in, 17
stop and limit orders terms in, 17
Decisions, impulsive, traders and, 29
Descending channel, 84–86
Descending trendline, 77–83
Diamond formation, 180–181 potential, 182–183
Discrete-systematic trading, 31
Discretionary methods vs. mechanical trading systems, 33–36
Double bottom formation, 42
Double top (bottom) formation, 89
Double top formation, 42
Double (triple) top (bottom) formation,
188–189
Dow retracement theory, 47
Dummy trading, 4–5, 62
Elliott Wave Theory, 46–47
End-of-the day analysis, 66–74
End-of-the-week analysis, 66–74
Entry stop order, 78, 120, 134
European trading session, opening position during, 122
EUR/USD chart:
downtrend on, 65
70-pip ranges on, 56
False break:
of trendline, 78, 80–83
of triangle formation, 91–92
Fibonacci lines, drawing, 69, 71
Flag formation, 93
Flat surface formation, 196, 198–199
FOREX market. See also FOREX
trading
dealer-customer relationships, 20 formations in, 72
specifications of, 7 trends of, 63–64 volatility of, 62–63
FOREX trading:
recent industry developments of,
22–23
speculative trade on, 54
Formations. See Technical formation(s) Fundamental analysis, advantages and
disadvantages of, 38–40
Gaps on daily charts, 72–73
Getting started:
dummy trading, 4–5
information, data feed, and technical support, 4
overview of, 3–4
Good move after trendline break, 90
Gunn analytical method, 46
Head and shoulders (H&S) formation,
42, 87–89 inverted, 69, 88, 186 potential, 184–185
Hit-and-run technique, 117, 126
Horizontal channel, 87, 164–169
Horizontal supports and resistances, 68
H&S. See Head and shoulders (H&S)
formation
Igrok method:
basic trading strategies and techniques, 77–93
choosing currency pair to trade, 95–96 entering the market, 117–123 evaluating probabilities using
technical analysis, 59–75 exiting the market, 125–131 importance of timing, 133–140 intraday trading plan principles,
113–115
market behavior and trader discipline,
103–109
money management rules and techniques, 97–102
philosophy of, 53–58
trading strategy during Central Bank intervention, 141–144
Impulsive decisions, traders and, 29
Inclined channel, 170–175
Indicators, 43–46, 69
Informative services, 4
Intermediate-to-long-term trend, 67–69
Internet trading, 18
Intraday chart, 73, 87
comb formation on, 194–195
flat surface formation on, 198–199
Intraday trade/trading:
advantages of, 112
money management and, 98 planning for, 113–114
rules and techniques of stops placing,
114–115 template, 145–146 timing and, 135
trading activity of, 117
Inverted head and shoulders formation,
69, 88–89, 186–187
Japanese candlesticks charts, 48–49
Legal issues, 20
LIBOR rates, 18
Limit orders, terms of, 17
Line-on-close chart (line chart), 69
Liquidation:
position, 125, 129–132
of profitable position, 122 of unprofitable position, 98
Longer-term market analysis, 67
Long position, 55–56, 84, 118
Long-term analysis, 4
Long Term Capital Management, 101
Loss:
averaging and, 99–101
in broken trendline, 80–81
central bank intervention and, 141 correcting, 98
in false break trendline, 81–82 in no break trendline, 79 potential, calculating, 120 recovery from, 30
in triangle and triangle like formations, 91–92
MACD, 69
Margin, 13, 15–16
Market. See also Market behavior; Market movement
approaching major trendline, 200–201 breaking trendline, 202, 204 characteristics of, 133–135
choosing entry point to, 117–118 constant motion of, 55–56
cycles, 135–140
drifting in one direction only, 150–153 drifting up and down on both sides,
148–149 emergence of, 78
entry timing rules, 118–123
in false break trendline, 78, 80–83 forming daily trading range, 56–58 forming 80–100 pips day range,
154–155
forming specific formation on daily chart, 192–193
making intraday high or low, 156–157 paradoxes of predicting, 38–40
profit-taking and speeding of, 126–127 trader unprofitable position and,
98–99
Market behavior:
discipline of trading and, 109 model of the market, 104–105 predictability of the market, 105–106 recommendation to beginning trader,
speculative trader and, 104 traders attitude and, 107–109
Market movement:
directions of, 53–54
new open position and, 119–120 opening position against, 115, 121, 122 placing stop-loss order, 142
traders and, 30
Mechanical trading systems, discretionary methods vs.,
33–36
Methods of definition, false breaks and,
Model of the market, 104–105
Money management: averaging and, 99–101 capital reserve and, 99 in false breaks, 82 overview of, 97–98
restricting loss and, 98–99 risk/reward ratio and, 101–102 tactics and strategy in, 98
Money market, 53, 54
Murphy, John, 40
Neckline, 42
New York trading session, opening position after, 122–123
No break of trendline, 79–80
OHLC chart. See Open-high-low-close bar (OHLC) chart
Omega SuperCharts (end-of-day)
software, 67–69
Online trading, 5, 18
Open-high-low-close bar (OHLC) chart,
Opening price:
market drifting in one direction only and, 150–153
market drifting up and down from,
148–149
Open position:
during Asian trading session, 122 at the break of neckline, 97
choosing an entry point and, 117–118 against current market movement,
115, 121
against major market move, 122–123 in market movement direction, 120 position liquidation and, 129–132 profit-taking and, 125–126 risk/reward ratio and, 101–102
rules for, 117
Orders, stop and limit, 17
Overtrade risk, 11
Patterns, 42–43
Point and figure chart, 48–49 “Postponed stops,” 115
Potential diamond formation, 182–183
Potential head and shoulders formation,
184–185
Potential triangle formation, 178–179
Precise borders formations, 93
Price:
closing, 64–66 opening, 64–66
Price level, opening positions and,
Probability evaluation technique,
59–61
Profit, 55
in broken trendline, 80–81
central bank intervention and fixing of, 144
exiting the market and, 125–132 in no break trendline, 79 recommendation concerning, 109 in triangle and triangle like
formations, 91–92
Profit/loss ratio, 101–102
Protective stop, placing, 120
Psychological challenges of speculative trading, 27–32
Quantum Fund, 101
Random position, 55
Recovery from losses, traders and,
Rectangle formation, 93
Reserve, capital, 99
Resistance, 118 horizontal, 68
Retractment Theories, 3
Reverse position, 129–132
Risk/reward ratio (RRR), 84, 101–102
Risks:
determining limits, 11–13 overtrade, 11 undercapitalization, 8–11
Rounded top (bottom) formation,
RRR. See Risk/reward ratio (RRR) RSI, 69
Safe short trade, 122
“Sell on weakness, buy on strength”
formula, 62–64
Sell position, 78
Short position, 55–56, 84, 118
Short-term trading, 111 template, 145–146
Shoulders formation. See Head and
Shoulder (H&S) formation
Side trend market movement, 53–54
Software, 67–69
Speculative trade/trader:
choice of currency for, 95–96 on FOREX, 54
market and, 104–106
money management and, 97 psychological challenges of, 27–32 strategy and tactics of, 57
Spread size, in dealer selection, 17
Statistical analysis, 62–64
Statistics, trading systems and, 36
Stochastics, 69
Stop and reverse position, 84
Stop-loss order, 143
Stop order, terms of, 17
Stops:
broken trendline and, 80, 81 channels and, 84
entry, 78
in inverted head and shoulders, 89 market technical levels and, 99 placing, rules and techniques of,
114–115 postponed, 115
Storage fees, 18
Strategy and tactics:
of money management, 98 of speculative trade, 57 trading, 31, 51, 121
of trading in intervention of central bank, 141–144
Stress factor, traders and, 27–28, 31,
Substitution, 96
SuperCharts (Omega Research), 4
Support, 118 horizontal, 68
Support and resistance templates.
See Trendline
Support and Resistance Theory, 3,
Technical analysis, 3
advantages and disadvantages of,
40–42
evaluating probabilities using,
59–75 philosophy of, 53 theories of, 46–47
Technical formation(s), 68. See also
Channel
diamond formation, 180–181 potential, 182–183
double bottom formation, 42 double top (bottom) formation, 89 double top formation, 42
double (triple) top (bottom)
formation, 188–189 flag formation, 93
head and shoulders formation, 42,
87–89, 186
inverted, 69, 88–89, 186 potential, 184–185
potential diamond formation, 182–183 potential triangle formation,
178–179
rectangles formation, 93 rounded top (bottom) and
V-formation, 93 templates, 159–189
triangles and triangle-like formation,
41–42, 89–93, 176–177 potential, 178–179
Technical support, 4
Templates, 145–146
average daily trading range,
148–157 sample trade, 146
short-term trading, 145–146 technical formation, 159–189 trendlines, support, and resistance,
191–205
Tiger Fund, 101
Timing:
importance of, 133–135 market cycles and, 135–140 profit-taking and, 128
rules for market entry, 118–123
Trader(s). See also Speculative trader; Trading
beginning, recommendation to,
broken trendline and, 80–81 choosing right dealer, 13–23 discretionary vs. mechanical trading
systems, 33–36 establishing an account, 7–13 false break trendline and, 80–83 getting started, 3–5
groups of, 37
impulsive decisions of, 29 intraday trading plan, 113–115 market recommendations for, 108 market relationship and, 29 mistakes of, 106
money management and, 98–102 in no break of trendline position,
profit recommendations for,
psychological challenges of speculative trading, 27–32
reaction of, 54
recovery from losses, 30
Trade sample, 207–209
Trade templates, guide to, 146
Trade theory, preparation on, 3
Trading. See also Intraday trading; Online trading; Short-term trading; Trading account; Trading method, developing
averaging trading techniques in,
99–101
based on ascending and descending trendlines, 77–83
based on channels, 84, 87
based on other technical formations,
87–91, 93
capital, insufficient, 8–11 cycle, 84
discipline of, 109 discrete-systematic, 31 dummy, 4–5, 62
importance of timing in, 133–140
Internet, 18
strategy of, 31, 141–144
Trading account:
about, 7–8
determining risk limit, 11–13 overtrade risk, 11
size of, 16–17
terms of opening, 22 undercapitalization risk, 8–11
Trading method, developing. See also Fundamental analysis; Technical analysis
discretionary vs. mechanical trading systems, 33–36
psychological challenges of speculative trading, 27–32
Trading range, daily, 56–58
Transaction execution, opening new position and, 118–119
Trendline. See also Break of trendline ascending, 77–83
descending, 77–83 drawing, 68–69
major, market approaches, 200–201 market breaking, 200, 202
no break, 79–81
support, and resistance templates,
191–205
Triangles and triangle-like formations,
41–42, 89–93, 176–177 potential, 178–179
Uncertainty, traders and, 29
Undercapitalization risk, in trading, 8–11
Undervalued currency, 204–205
Uptrend sample, 65
USD/CHF daily chart, 60
USD/DEM chart:
daily, comb formation on, 73–74 medium-term local trends on, 74 monthly, bullish triple divergence,
USD/JPY daily chart, double bottom formation on, 42
USDX, unfilled gap on daily chart, 72
V-formation, 93, 126
Virtual dummy trading, 5
Weekly chart: analysis, 67–72 cable on, 43
Wishful thinking: avoiding, 107 traders and, 28–29
Date: 2015-12-17; view: 1410
| <== previous page | | | next page ==> |
| Technical Formation Templates | | | Carbohydrates - Sugars and Polysaccharides |