CATEGORIES:
BiologyChemistryConstructionCultureEcologyEconomyElectronicsFinanceGeographyHistoryInformaticsLawMathematicsMechanicsMedicineOtherPedagogyPhilosophyPhysicsPolicyPsychologySociologySportTourism
Water flow of North Caucasus rivers along Black sea coast
Figure 10 illustrates the practical travel range of a vehicle powered by a fuel cell (FC) compared to lead acid, NiMH or Li-ion batteries. One can clearly see that lead- and nickel-based batteries simply get too heavy when increasing the size to enable larger distances. In this respect, the fuel cell enjoys similar qualities to the IC engine in that it can conquer large distances with only the extra weight of fuel.[14]
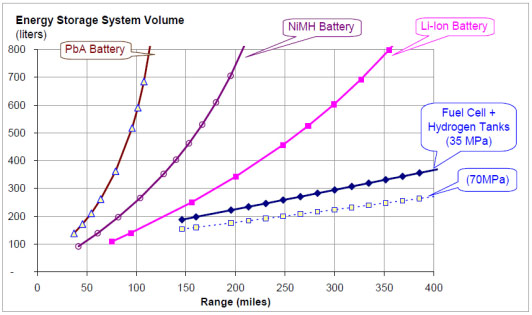
Fig. 10 - Comparison in energy consumption
Fuel cells have less emissions than other types of powerplants, and as believe analytics it would be decreased to extra low values by 2050. (Fig. 11)

Fig. 11 – Power Source’s Comparison in terms of emissions and driving range
Conclusion
The potential for fuel cells to provide zero or near-zero emissions has been a significant force in the development of the technology over the past 30 years, and is drawing increasing attention to the technology today.
* Because there is no combustion in a fuel cell, fuel is converted to electricity more efficiently than any other electrical generating technology available today.
* There are no moving parts in a fuel cell stack, making them more reliable and quieter than generators. Even the ancillary systems (fans, pumps, controls, etc.) in a complete fuel cell unit are relatively mature and simple technologies that should prove extremely reliable.
* Unlike batteries that must be disposed of once their chemicals are used up, fuel cell reactions do not degrade over time and can theoretically provide continuous electricity.
* Traditional power plants must be large in order to gain efficiency, but fuel cells can achieve higher efficiencies at any scale, making them perfect for small portable, residential, and transportation uses.
* Because fuel cells are clean and efficient at any size, they can be located almost anywhere, including dense urban areas where both air quality and transmission congestion may be of concern. Fuel cells can offer an alternative to building new power lines, while also reducing American dependence on foreign oil. Fuel cells can provide more reliable power wherever electricity is needed, making the whole electric power grid more robust and reliable. Distributed application of small fuel cells will also enhance security of key infrastructures, such as our communication and water systems.
We are currently in a transition period now, where many fuel cell companies are investing literally hundreds of millions of dollars to gear up for mass manufacturing at the same time they are trying to begin to develop a variety of markets for their product. Currently, there is no hydrogen infrastructure to supply coast-to-coast delivery of hydrogen fuel. Technologies are being developed to provide alternative fuel storage and delivery methods.
References
[1] "Fuel cells", http://www.altenergy.org/renewables/fuel_cells.html
[2] "Fuel Cell Handbook", EG&G Technical Services, Inc., 2004
[3] "Automotive Fuel Cells The Road to Emission Free Mobility", Craig Louie,AFCC Automotive Fuel Cell Cooperation Corp. Burnaby, Canada
[4] "Fuel Cell Power System for Utility Vehicle", M. Graham, F. Barbir, F. Marken, M. Nadal,Program and Abstracts 1996 Fuel Cell Seminar, November 17-20, 1996, Orlando, FL, pp. 571-574.
[5] "Life-cycle analysis of fuel cell system components", M. Pehnt
[6] "Hydrogen and Fuel Cell Vehicles Worldwide". TÜV SÜD Industrie Service GmbH, accessed on August 2, 2011
[7] "Controlled Hydrogen Fleet and Infrastructure Demonstration and Validation Project", Wipke, Keith, Sam Sprik, Jennifer Kurtz and Todd Ramsden. National Renewable Energy Laboratory, September 11, 2009, accessed on August 2, 2011
[8] "Hydrogen Is Down, But Not Out", Squatriglia, Chuck.,Wired.com, Autopia, March 17, 2011, accessed on August 2, 2011
[9] "Mercedes-Benz Fuel Cell Car Ready for Market in 2014", Lienert, Anita. Edmunds Inside Line, June 21, 2011.
[10] "Fact Sheet: Materials Handling and Fuel Cells". Fuel Cell and Hydrogen Energy Association.Accessed August 2nd 2011.
[11] "Early Markets: Fuel Cells for Material Handling Equipment". U.S. Department of Energy Fuel Cell Technologies Program, February 2011, accessed August 2, 2011
[12] "The ENV Bike". Intelligent Energy. Retrieved 2007-05-27.
[13] "APFCT won Taiwan BOE project contract for 80 FC scooters fleet demonstration", (http://www.apfct.com/article_cat.php?act=view&no=26)
[14] "Fuel cell vehicles" (http://batteryuniversity.com/learn/article/fuel_cell_vehicles)
[15] "Modeling and control of fuel cell systems and fuel processors", J.T. Pukrushpan, 2003
Water flow of North Caucasus rivers along Black sea coast
The subtitle
Waiting for Winter Olympics of 2014 – preconditions for researches in influence of Olympics constructing on the water flow and river regime.
Maria Kolesnikova, EGEA Moscow, Lomonosov Moscow State University
Abstract
The Black Sea coast region is an object of special interest of Russian and foreign scientific society for the last time because of Winter Olympic Games – 2014 in Greater Sochi. Construction of the Olympics objects strongly influences on environment of natural geosystems and its parts. Water environment is an important part of these geosystems too. The main objective of this research were rivers from the Black Sea basin in Russian and Abkhazian territory. Forming of these rivers’ flow depends on many factors, both zonal and azonal. The average long-term discharge and water flow of the rivers is under great influence of many factors, including mean height of the catchment and stream order.
For the better valuation how preparations to the Winter Olympic Games influence on the water bodies, it’s necessary to learn common features of water flow forming for rivers of this region in the period before the beginning of the Olympics constructing. The connections which were found create preconditions for researches in influence of Olympics constructing on the water flow and river regime.
Keywords
WATER INFLOW, AVERAGE WATER DISCHARGE, THE NOTH CAUCASUS REGION HYDROLOGY, THE BIG SOCHI REGION
Text
Introduction
Because of Winter Olympic Games - 2014 the Greater Sochi region became the field of interests for many people, including scientists and of course geographers. Human activity always causes changes in nature. Constructing of Olympic buildings can be the reason of the really big changes. That’s why the region situated close to building area should be studied more. From the beginning of time when the first hydrological measurements were made till the time constructing of Olympic buildings was ready to be started we had almost undamaged nature in this region. So, to find out differences caused by Olympics first we need to make a research about the past of this region. In the current case – about the Water flow of North Caucasus rivers along Black sea coast before the beginning of Olympics’ changings of the environment.
Studyarea
The region has an amount of special features due to natural borders. The nature there is really rich with different types of environment. Mountain chains help to defend the territory from the cold air masses from the north. Also because of westerlies from the warm Black sea cyclonic air masses come which creates high thermal condition.
In the north-west part of territory catchment areas have features usual for the prairie-steppe and in the south-east part for the subtropics climate zone. By the reason of special relief components vertical differentiation and wide variety of climatic conditions take place (Surface-water resources of USSR. Hydrologicalscrutiny., 1966).
Methodology
In the research, average long-term data array with information on all the gauging station along the explored territory. For every river in section line of gauging station streams’ orders were defined according to method of Scheidegger, using the equation N = log2(P) + 1, P – number of streams with length less than 10 km (Scheidegger A.E., 1961.). Besides the stream orders catchment area and mean height of catchment can be used as predictors. All the relations were constructed in MS Excel.
The main object with assessment of average long-term discharges data is the valid chose of representational period. Used data from gauging stations can have different length of observation. For the stations with extended period of observation differential-integral curves should be constructed. For the gauging-stations which has not really long period of measurement long-term discharge can be found using differential-integral curve of analogue-station with the longest observation period and with the highest correlation rates.
For the maximum and minimum water discharges probability curves were constructed using the software (“StokStat 1.1”, SF VNIIpriroda, Levikin U. V., 2000).
Results and discussion
From all data available 18 gauging stations with observation time at least 20 years (Government water cadaster. Long-termdataofregimeandland surface-water sources.,1987; Surface-water resources of USSR.Common hydrological characteristics., 1965, 1974, 1979)
Data of average, maximum and minimum water discharges were processed. Used data from each of 18 gauging stations have different length of observation: from 20 to 80 years.For the 18 stations with extended period of observation differential-integral curves were constructed. Finally, for 12 stations with more than 25 years of observation smoothing of data were done over whole time period. For the other 6 stations smoothing of data was done in a different way – using differential-integral curve of analogue-station with the longest observation period and with correlation rate no less than 0,7.Finally, for all 18 gauging stations average long-term water discharges were assessed. Resulted average relative discharge of flow demonstrate relation with mean height of catchment.
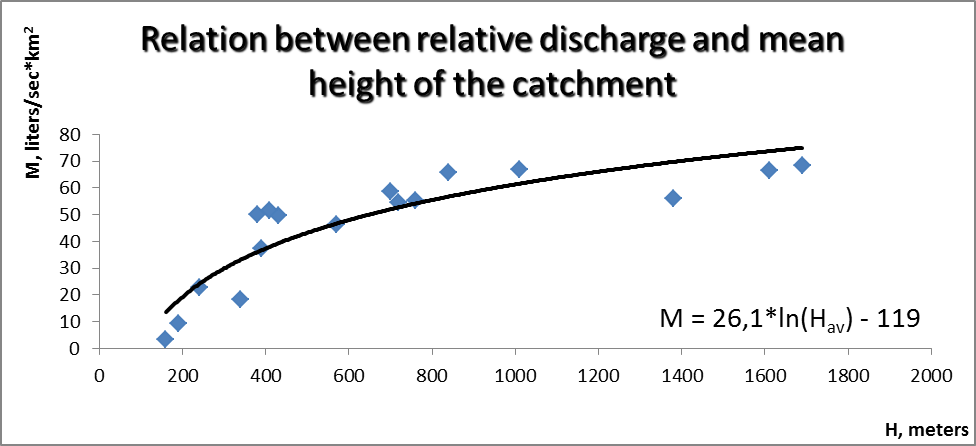
Fig. 1 “Relation between relative discharge and mean height of the catchment”, 2013, author’s own.
For the better spatial analysis all the average relative discharges were transformed to the 500 meters height with an equation M500 = M – 26,1*ln(Hav/500) and mapped.
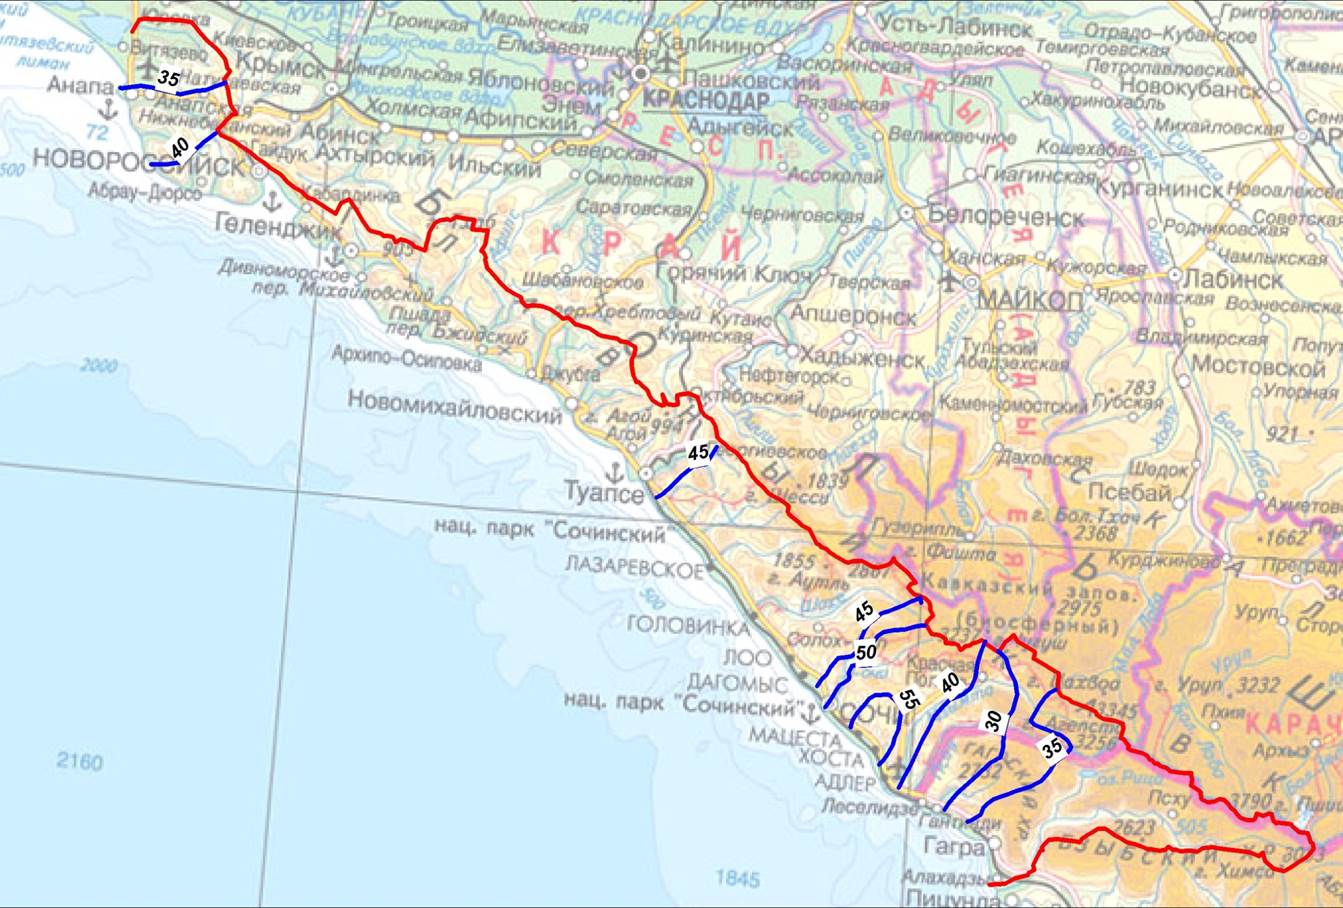
Fig.2. “Average relative discharge reduced to the height of 500 meters”, 2013, author’s own.
It makes possible to recognize the flow increase from the north-west to the south-east along the Black Sea coastal line. It happens because of more water saturation of atmospheric masses in this direction. The same tendency precipitationshave.
There was set a relation between long-term average discharges and stream orders.
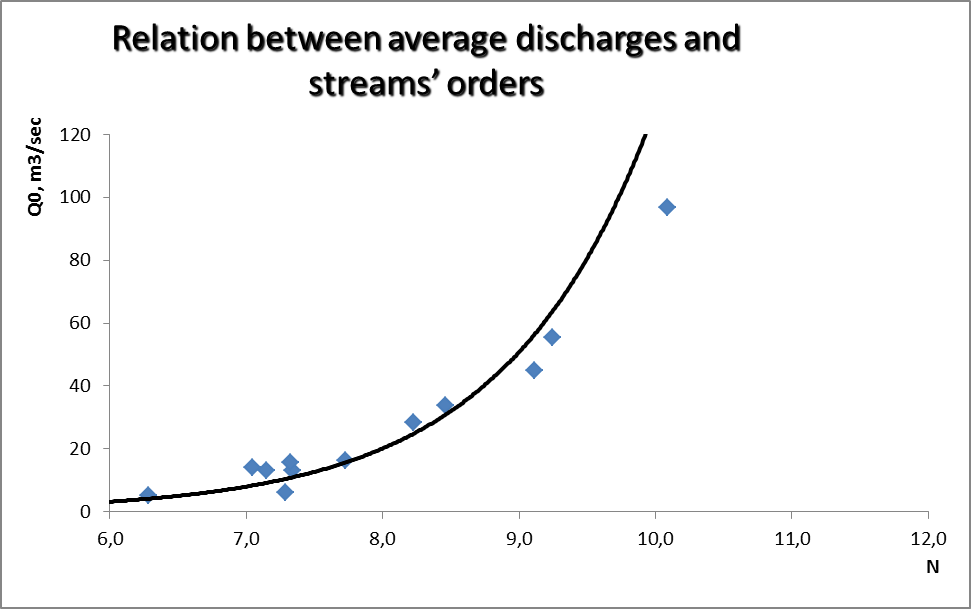
Fig.3. “Relation between average discharges and streams’ orders”, 2013, author’s own.
There is an exponential equation for this
Q0 = 0,049*e0,76*N.
Deviations of actual discharge from the counted with help of this equality one don’t show any connection with height of catchment or spatial regularity. It means that factors which influence on water flow increase influence on the stream order either. It should be said that the relation is homogeneous for the whole territory despite it is situated in different natural environment.
Also attention was paid to the maximum and minimum water discharges. For them probability curves were constructed and then discharges with probability 10% and 90% were determined.
As for factors which influence on the maximum and minimal discharges, maximum relative discharges decrease with the increasing of the catchment area which is explained by reduction of maximum flow. Relation can be written with the help of polynomial equationМ200 = М*(200/F)-0,837 and it can be transformed to a form for 200 km2 catchment area. Then these data were analyzed. Results were shown on the map.
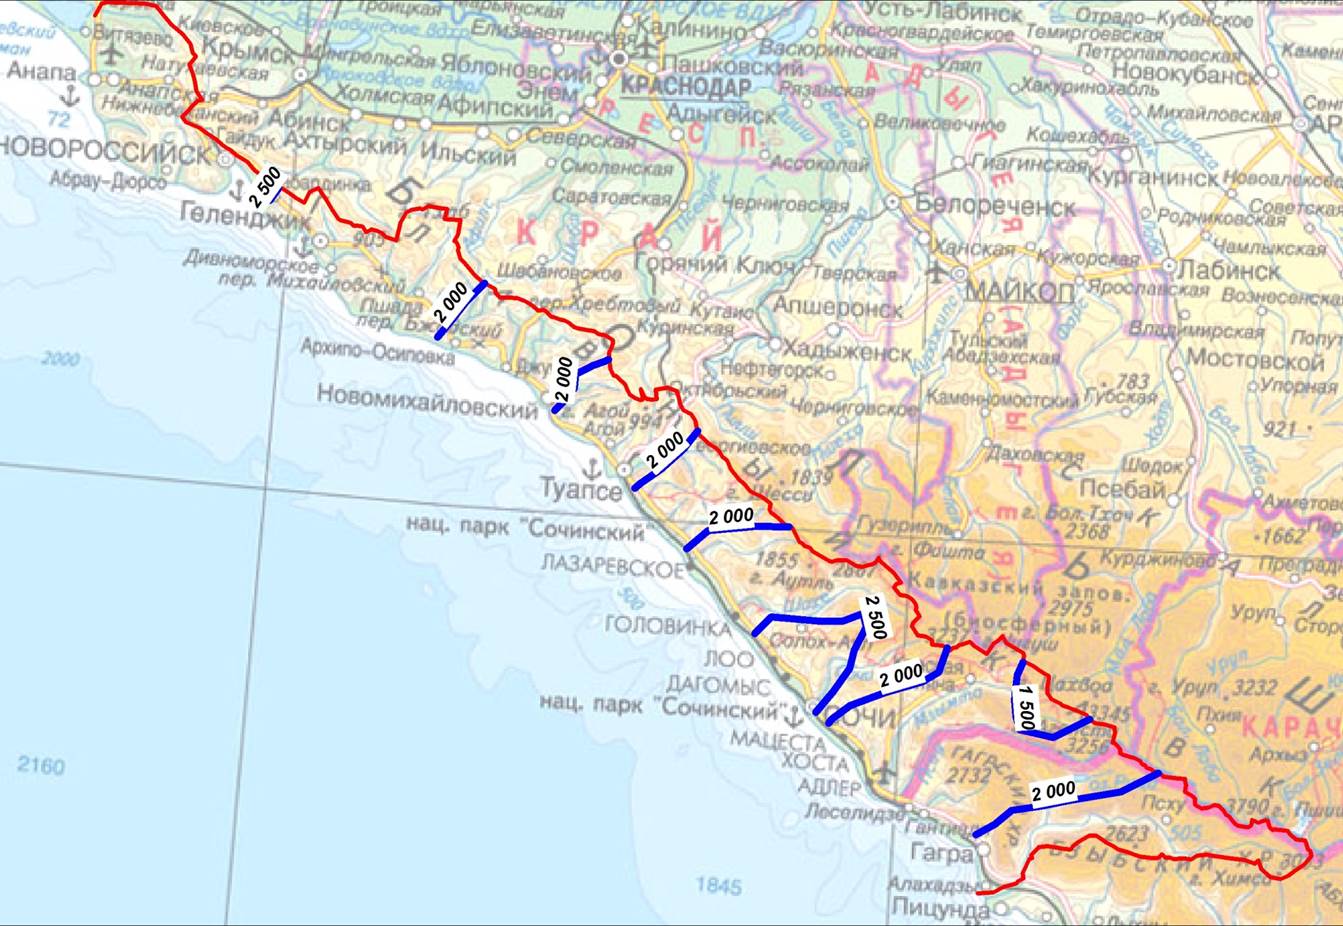
Fig.4. ”Maximum relative discharge for F = 200 km2 ”, 2013, author’s own.
Maximal values of maximum discharge modulus are situated in the north-west area of the catchment. Moving south-east, they are reduced with minimal value in the mountain area of Mzimta catchment. An interesting relation was found out – in the north-west areas, where average long-term relative discharges were minimal maximum relative discharges reach their maximum value. In the south-east area there is an opposite relation.
It happens because of the type of the flow pattern. If we compare discharge records of different rivers – it’s clear that in the north-west area annual discharge disposal is connected with rare floods when singular water discharges go beyond low flow values.
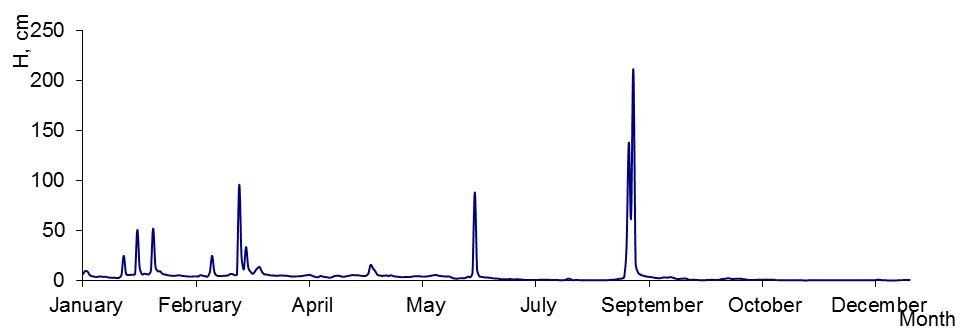
Fig.5. ”The types of intra-year flow pattern, River Vulan – vil. Arhipo-Osipovka”, 2013, author’s own.
In the south-east area flood periods can be distinguished. Floods happen more often but less intensive.
d ftuuv2qP7cVetjd/ebn/7XK8e9FPnz/cLdvjEyDAY4bQcGjvt3cSIbz6bwEAAAD//wMAUEsBAi0A FAAGAAgAAAAhAPVq/LkgAQAAXgIAABMAAAAAAAAAAAAAAAAAAAAAAFtDb250ZW50X1R5cGVzXS54 bWxQSwECLQAUAAYACAAAACEAOP0h/9YAAACUAQAACwAAAAAAAAAAAAAAAABRAQAAX3JlbHMvLnJl bHNQSwECLQAUAAYACAAAACEArcRhbd4AAAAFAQAADwAAAAAAAAAAAAAAAABQAgAAZHJzL2Rvd25y ZXYueG1sUEsBAi0AFAAGAAgAAAAhAGStaSoDAQAALQIAAA4AAAAAAAAAAAAAAAAAWwMAAGRycy9l Mm9Eb2MueG1sUEsBAi0AFAAGAAgAAAAhAKsWzUa5AAAAIgEAABkAAAAAAAAAAAAAAAAAigQAAGRy cy9fcmVscy9lMm9Eb2MueG1sLnJlbHNQSwECLQAUAAYACAAAACEAWFXjIxQBAAB6AQAAIAAAAAAA AAAAAAAAAAB6BQAAZHJzL2NoYXJ0cy9fcmVscy9jaGFydDEueG1sLnJlbHNQSwECLQAUAAYACAAA ACEAlzkusl8WAAAlgQAAFQAAAAAAAAAAAAAAAADMBgAAZHJzL2NoYXJ0cy9jaGFydDEueG1sUEsF BgAAAAAHAAcAywEAAF4dAAAAAA== "> 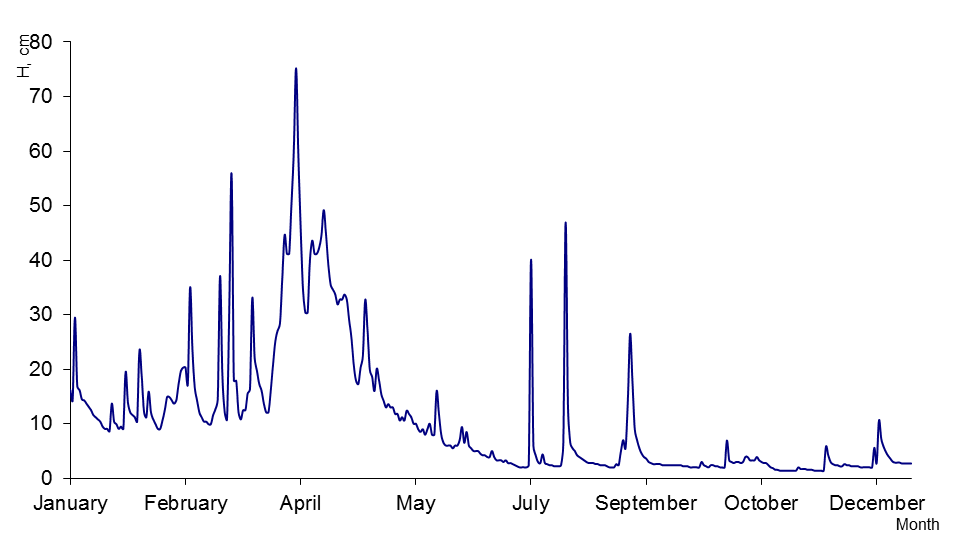
Fig.6. “The types of intra-year flow pattern, River Sochi – vil. Plastunka”, 2013, author’s own.
So excess of maximum discharges to average here is not so large.
Using minimum water discharge changes the territory can be divided into the same two parts either.
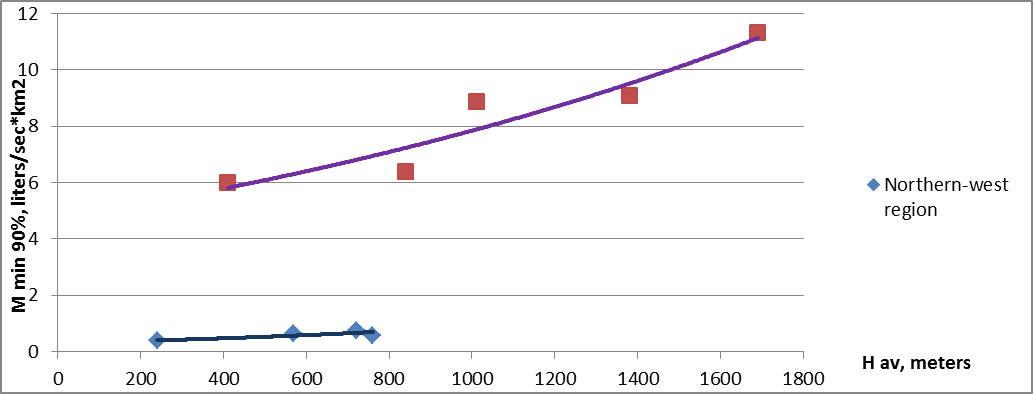
Fig. 7.”Minimal flow”, 2013, author’s own.
In the both areas minimum discharge modulus with 90% probability are increasing with the increasing mean height of the catchment. But due to high-altitude zone influence in the south-east are it happens faster than in north-west. Ceteris paribus minimum relative discharge in the north-west area is less than in the south-east. Also as well as maximum discharges, it can be explained with the type of intra-year discharge disposal.
Conclusions
The research was made in order to find more information to use it for further work on this region. It’s relevant because of upcoming Olympic Winter Games and changes in nature caused by them. It influences on everything including hydrological characteristics like average water discharges, relative water discharges, maximum and minimum water discharges and relations between water flow and predictors – stream order, catchment area and mean height of catchment. That’s why this research is strongly needed to determine further changes.
Acknowledgements
The author wishes to thankPHD Senior Lecture, Alexey Kosizkiy for his support for this research.
References
Surface-water resources of USSR.Hydrologicalscrutiny.Leningrad, Hydrometeoizdat., 1966.
Scheidegger A.E. Theoretical geomorphology.Berlin.Springer, 1961.333 pp.
Government water cadaster.Long-termdataofregimeandland surface-water sources.Leningrad, Hydrometeoizdat., 1987.
Surface-water resources of USSR.Common hydrological characteristics.Leningrad, Hydrometeoizdat., 1965, 1974, 1979.
Date: 2014-12-29; view: 3699
| <== previous page | | | next page ==> |
| Comparison with other energy sources | | | Hollywood dubbing: The German Bruce Willis and other invisible stars |