CATEGORIES:
BiologyChemistryConstructionCultureEcologyEconomyElectronicsFinanceGeographyHistoryInformaticsLawMathematicsMechanicsMedicineOtherPedagogyPhilosophyPhysicsPolicyPsychologySociologySportTourism
The Effects of Changes in Demand and Supply
The Effects of Shifts in Demand. Suppose, after years of floundering near the bottom of your basketball conference, your team has a miracle season and finds itself on the way to the state tournament. Lauren and Ralph, being bright young entrepreneurs, develop a special T-shirt for the occasion. The demand for shirts increases. This is reflected in Table 3-10.
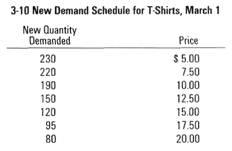
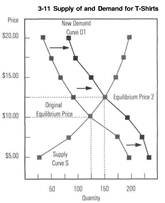
Figure 3-11 adds this data to the graph. The new curve, D1, appears to the right of the original curve, D. This reflects the increase in the quantity demanded at every price.
The increased demand has resulted in a new equilibrium price of $12.50 and a new equilibrium quantity of 150 shirts that will be sold.
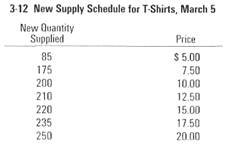
The Effect of Shifts in Supply. Now, assume that Lauren and Ralph are not the only entrepreneurs aware of your school's accomplishment, and several other T-shirt businesses print similar shirts.
Figure 3-13 illustrates the increase in supply as a shift of the supply curve to the right. Once again, there is a new equilibrium price of $7.50 per shirt, and a new equilibrium quantity of 175 units. Thus, an increase in the supply of an item results in a decrease in its market price.
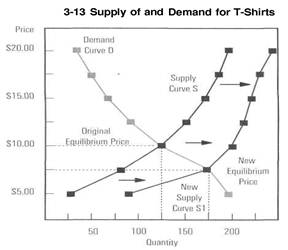
By contrast, a decrease in supply would have shifted the curve to the left, where the intersection with the demand curve will be at a higher price. In other words, a decrease in supply will result in an increase in market price.
Date: 2015-02-16; view: 1583
| <== previous page | | | next page ==> |
| Equilibrium | | | How the Price System Answers the What, How and Who Questions |