CATEGORIES:
BiologyChemistryConstructionCultureEcologyEconomyElectronicsFinanceGeographyHistoryInformaticsLawMathematicsMechanicsMedicineOtherPedagogyPhilosophyPhysicsPolicyPsychologySociologySportTourism
Elasticity of Demand
While demand curves always slope downward from left to right, the shape and slope of the demand curves for different products often are quite different. If the price of a quart of milk were to triple from $.80 to $2.40, people would buy less milk. If the price of cola drinks were to triple from $1 to $3 a quart, people would buy less cola. But even though both prices changed by the same percentage, the decrease in milk sales would probably be far less than the decrease in cola sales. This is because people can do without cola more easily than they can do without milk. The quantity of milk purchased is less sensitive to changes in price than is the quantity of cola. Economists would explain this by saying that the demand for cola is price elastic and the demand for milk is price inelastic. Elasticity describes how much a change in price affects the quantity demanded.

Why Is the Elasticity of Demand Different for Different Goods and Services? When the demand for an item is inelastic, a change in price will have a relatively small effect on the quantity demanded. When the demand for an item is elastic, a small change in price will have a relatively large effect on the quantity demanded. The demand for some goods and services will be inelastic for one or more of the following reasons:
• They are necessities. Regardless of a change in price, buyers continue to purchase necessities. Bread, milk, gasoline, and similar products have inelastic demand curves.
• It is difficult to find substitutes. Cola has an elastic demand curve because it is easy to substitute fruit juices, mineral water, or other carbonated drinks for cola. But, there are few substitutes for milk.
• They are relatively inexpensive. People are less likely to change their buying habits when the price of something that is relatively inexpensive is increased or decreased. If, for example, the price of an item were to double from 10 cents to 20 cents, it would have less of an effect on demand than if the price had gone from $250 to $500.
• It is difficult to delay a purchase. When your car is running out of gas, it is not always possible to shop for the best deal.
How Elasticity Is Measured. Elasticity can easily be measured by the "revenue test." Total revenue is equal to the
price times the number of units sold. If a price increase causes total revenue to fall, then demand would be described as elastic. If total revenue increases following a price increase, the demand would be inelastic between those two prices.
Similarly, if the price decrease led to a fall in total revenue, the demand for the item would remain inelastic. But if total revenue rose following a price decrease, demand would be elastic.
Super Sally's Market sells 500 quarts of milk and 100 quarts of cola daily. At $.80 a quart she earns $400 for milk. At $1 a quart she receives $100 for cola. Last week she increased milk and cola prices by 50 percent-milk sold for $1.20 a quart, and cola for $1.50. Following the price increases, milk sales slipped to 350 quarts daily, while soda sales dropped to 35 quarts.
Total milk revenue rose to $420 following the price increase, because the demand for milk is inelastic. Total cola revenue fell to $52.50, so one can say that the demand for cola is elastic.
Supply
Most people have a natural understanding of demand because of the time and effort they spend shopping for good deals. It just makes sense that consumers prefer to pay as little as possible for a product. It is also logical that producers will sell more at low prices than at high prices.
But does this mean that sellers are eager to ask a low price for their products? No. Producers and sellers have different needs and interests than buyers, and prices send different messages to them than they do to buyers. As prices rise, producers hope to sell more of their products. At low prices, they begin to look for different ways to use their materials, equipment, shelf space, and other resources more profitably.
Economists call the number of items sellers will offer for sale at different prices at a particular time and place supply. And just as it is possible to develop a demand schedule for T-shirts (or any other product), it is also possible to develop a supply schedule illustrating the quantity of a product suppliers would offer for sale at different prices. Table 3-4 is the supply schedule for that day the friends conducted their survey. It shows how many T-shirts they were willing to make at different prices.
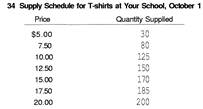
The Law of Supply. As the supply schedule shows, Lauren and Ralph would love to sell more T-shirts at high prices than at low ones. This agrees with the law of supply, which states that sellers will offer more of a product at a high price and less at a low price.
Why does the quantity of a product supplied change at different prices? The answer is that producers supply things to make a profit. The higher the price, the greater the incentive to produce and sell the product. Wouldn't you rather sell 300 shirts at $20.00 each than at $5.00 each?
If the students are willing to pay high prices for T-shirts, Lauren and Ralph may buy new and better equipment or hire a helper to produce and sell more shirts. If prices stay high, other students might notice Lauren and Ralph's success and start their own T-shirt business. However, if prices fall, they will consider the opportunity cost of using their resources to make T-shirts, and many will probably find other uses for their time and energy.
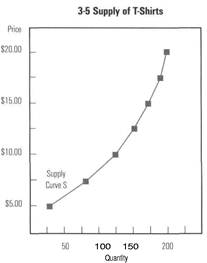
The Supply Curve. A supply curve shows the relationship between the price of a product and the number of units sellers will offer for sale. Figure 3-5 is a supply curve illustrating the data contained in the supply schedule (Table 3-4). It slopes upward, from left to right.
Changes in Supply. Like demand curves, supply curves can change or shift. When supply changes, the entire supply curve shifts either to the right (not "down") or to the left (not "up"). This is simply another way of saying that sellers will be offering either more or less of an item at each and every possible price. Any or all of the following changes are likely to affect the quantities supplied.
• Changes in the cost of production. If it costs sellers less to produce their products, they will be able to increase the supply, at the same or lower prices. Many businesses invest in research to discover ways to improve production strategies, find better and less expensive materials, and design more efficient machines to reduce production costs. Many employees suggest ways to reduce costs and improve efficiency. An increase in production costs will have the opposite effect—supply will decrease.
• Other profit opportunities. Most producers can make more than one product. If the price of a product they have not been producing (but could if they chose to) increases, many will shift their output to that product. For example, as personal computers became popular, people needed computer stands. As a result, many furniture manufacturers began to produce desks and carts specifically designed for the computer market.
• Change in the number of sellers/producers. When new businesses enter a market, the supply will increase. Mountain bikes became popular in the 1980s and the number of businesses producing and selling them has increased dramatically.
• Future expectations. If producers expect prices to increase in the future, they may increase their production now to be in position to profit later. If prices are expected to decline in the future, producers may reduce production.
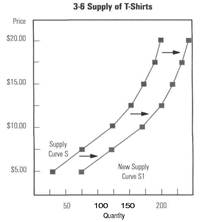
If other T-shirt businesses enter the market at your school, or if your friends bought new and more efficient equipment, you could expect the supply of T-shirts to increase. An increase in supply is illustrated in Figure 3-6.
Date: 2015-02-16; view: 2072
| <== previous page | | | next page ==> |
| Changes in Demand | | | Elasticity Of Supply |