CATEGORIES:
BiologyChemistryConstructionCultureEcologyEconomyElectronicsFinanceGeographyHistoryInformaticsLawMathematicsMechanicsMedicineOtherPedagogyPhilosophyPhysicsPolicyPsychologySociologySportTourism
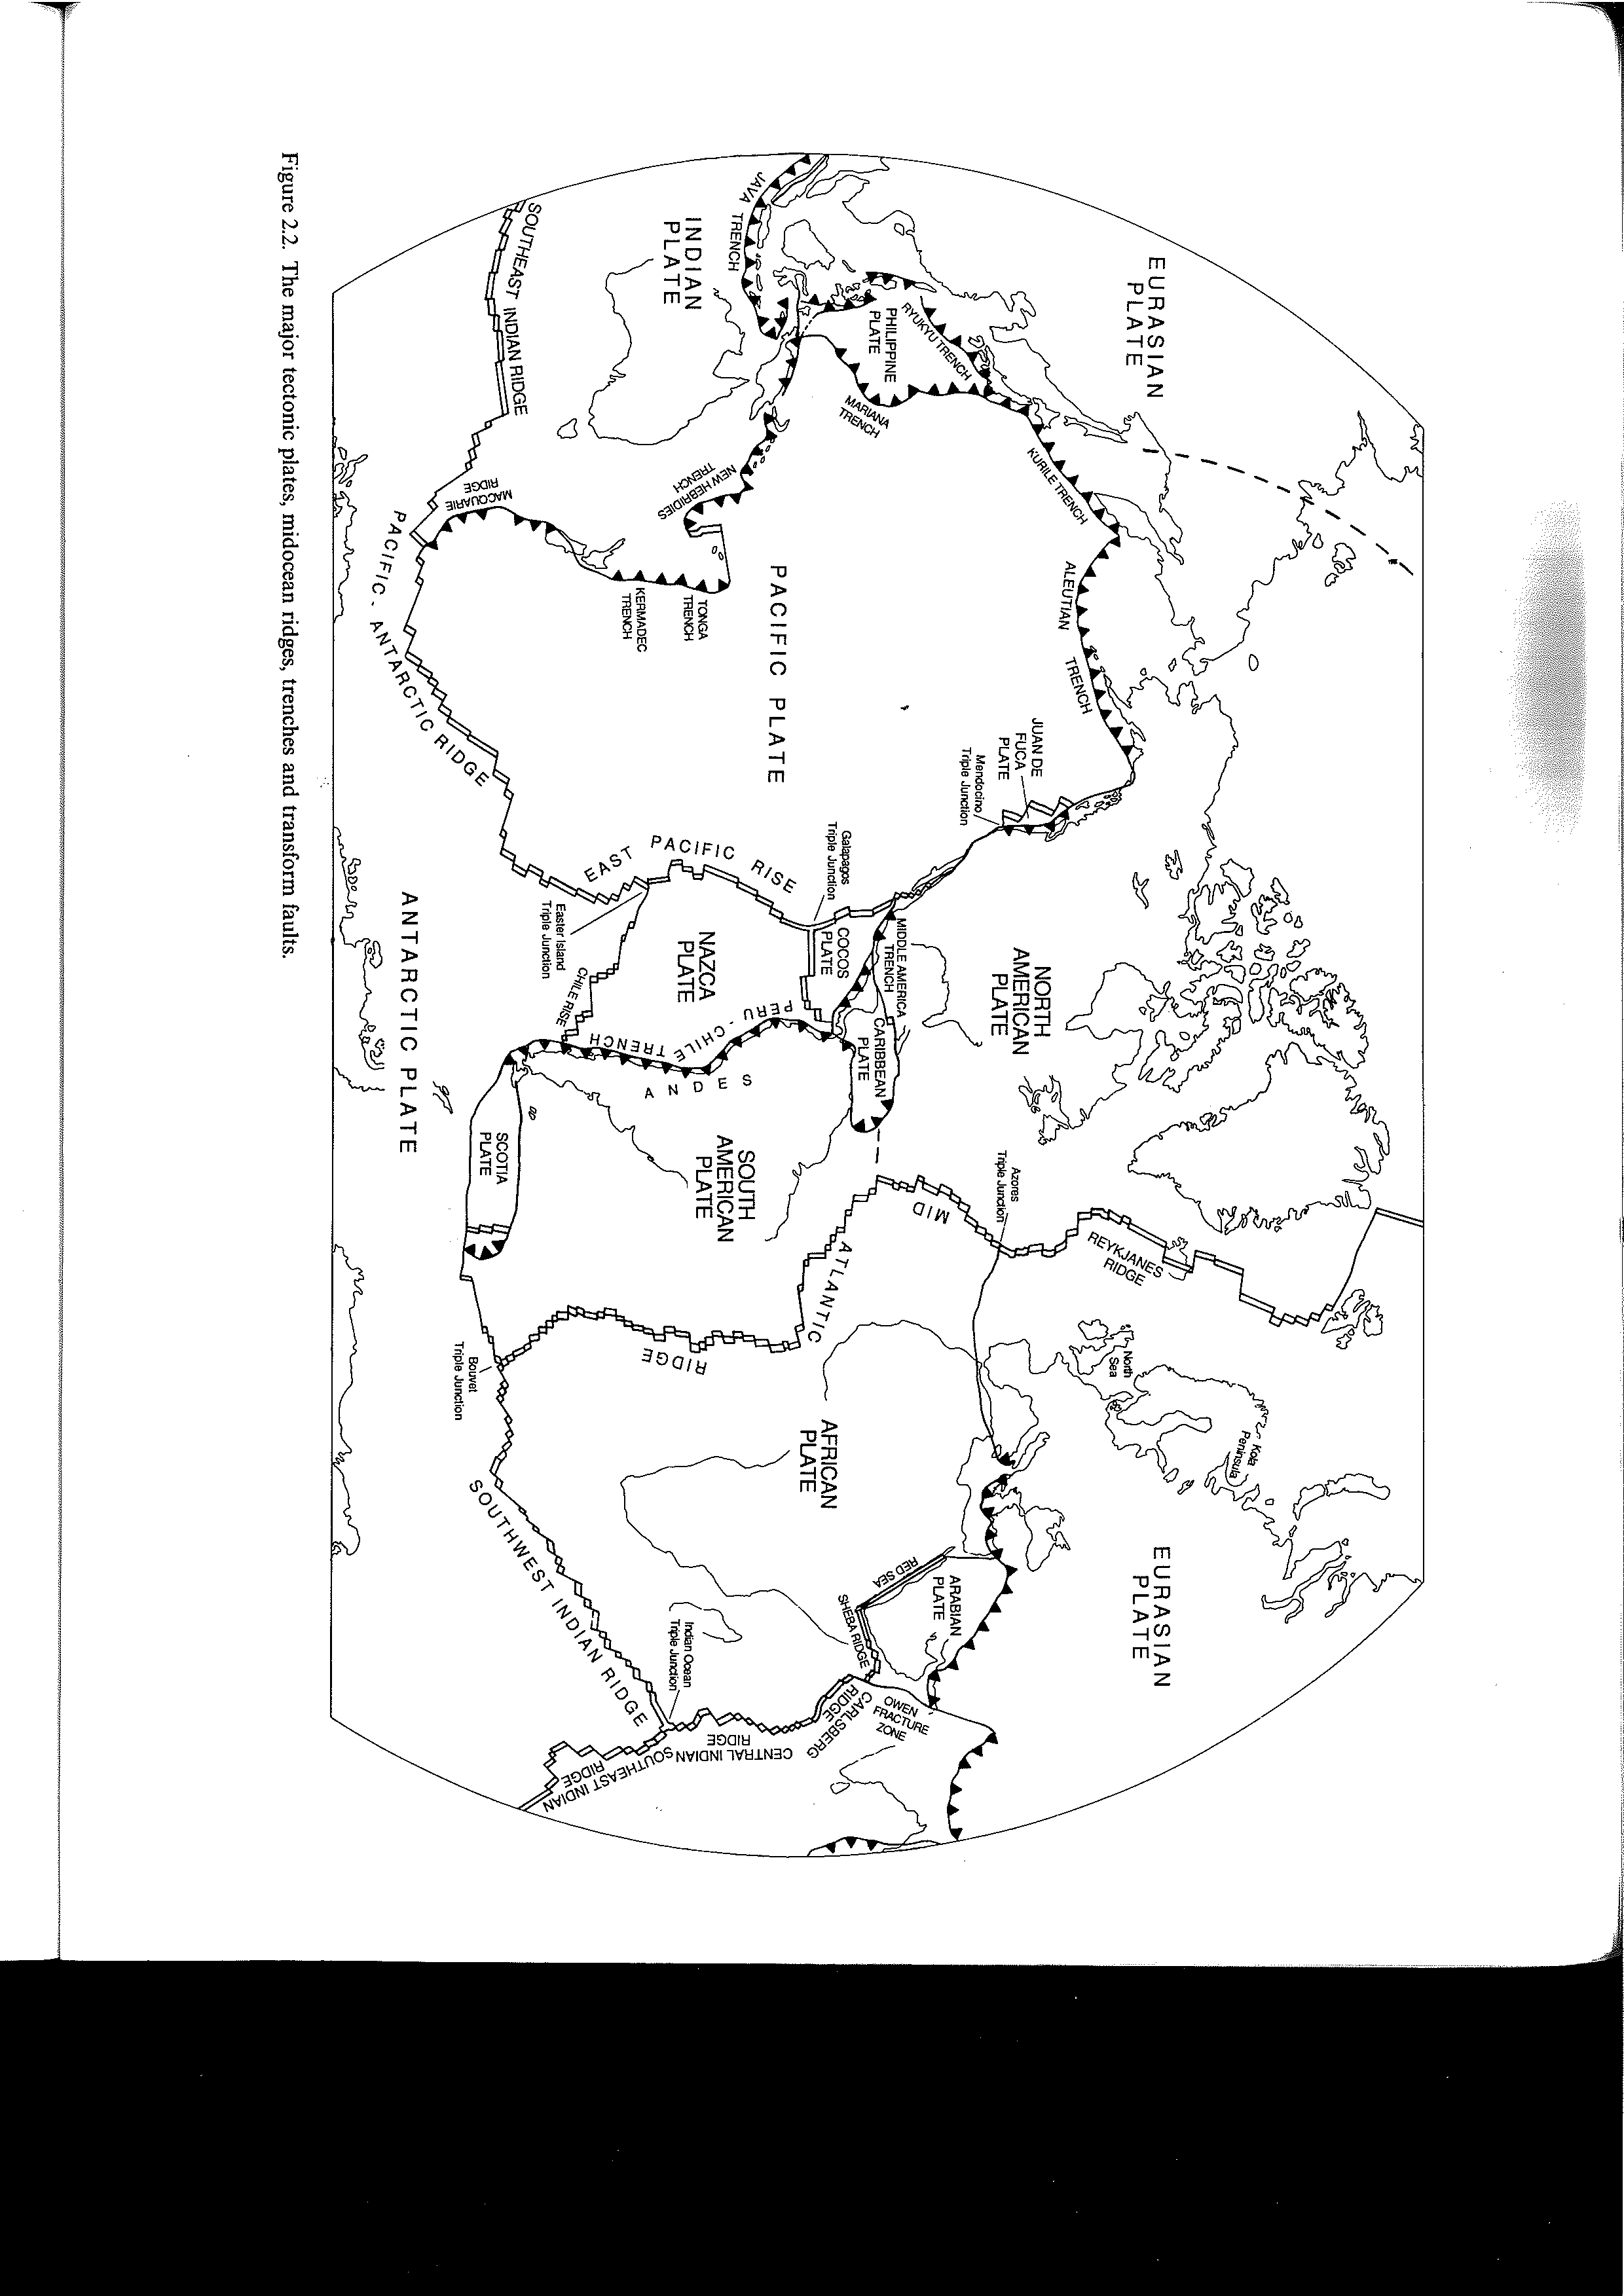
Mouvements between plates
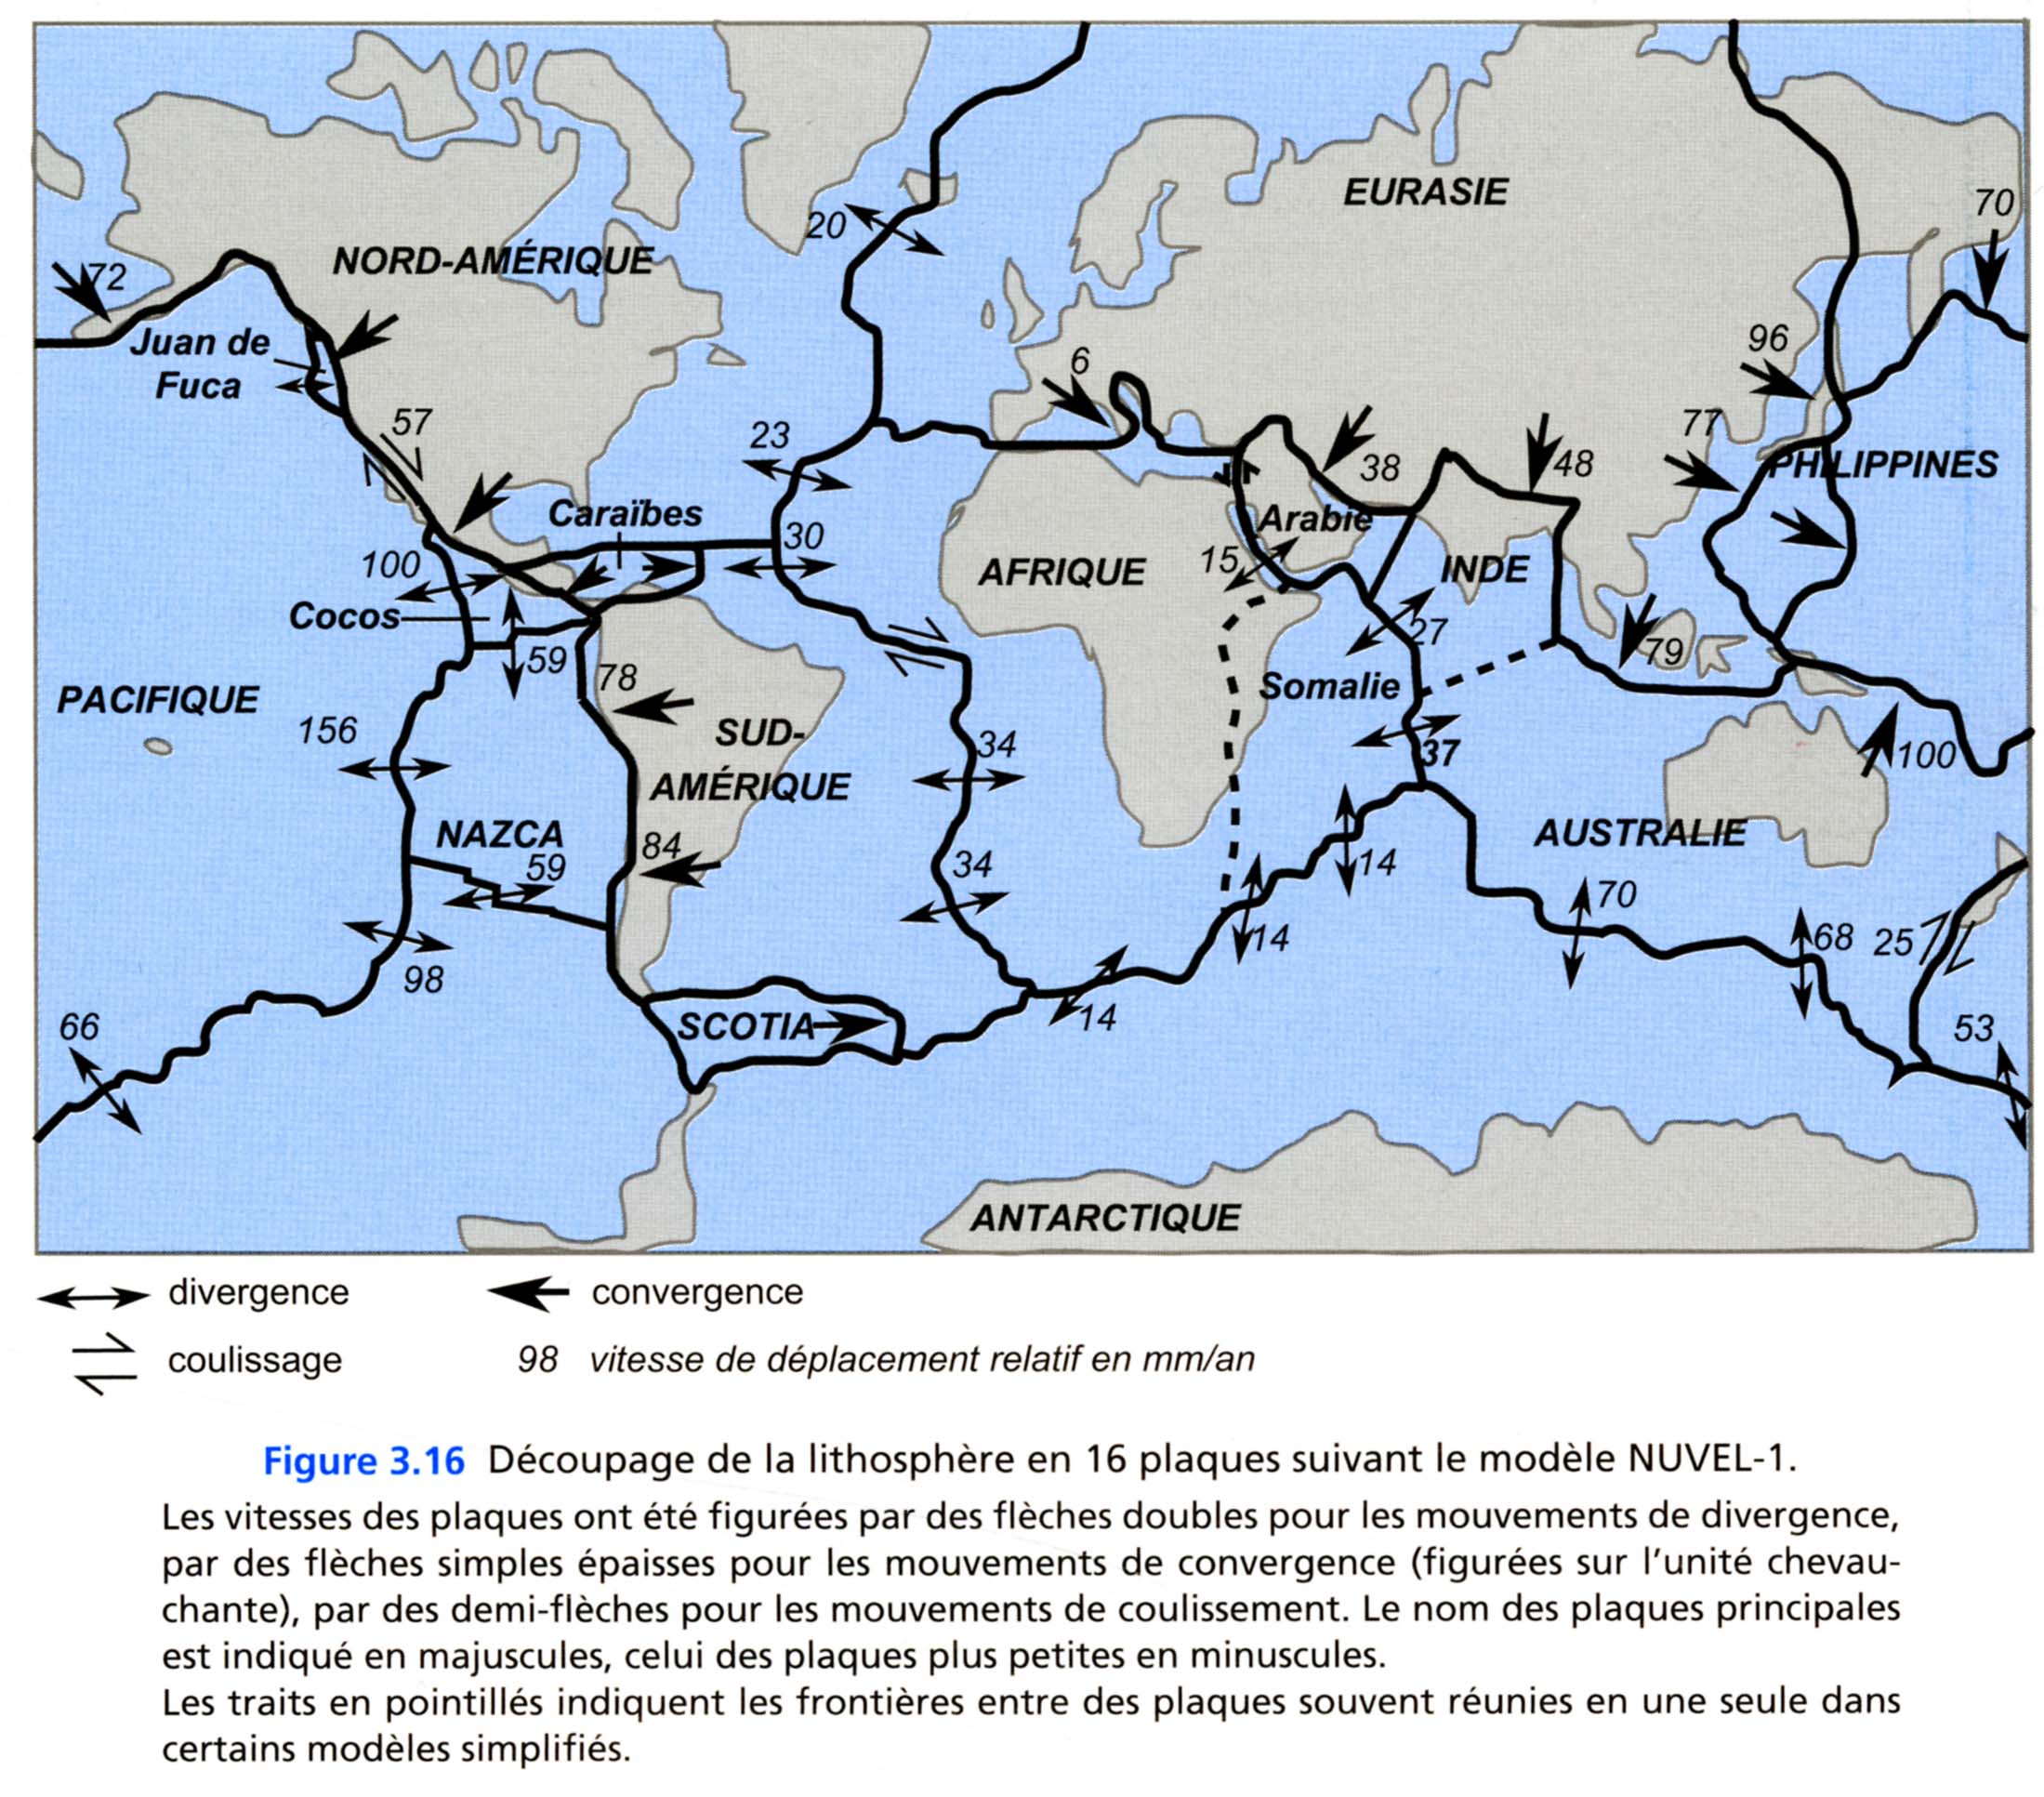
Caption : plate distribution according to the NUVEL-1 model (16 plates). Arrows give relative speeds between plates (in mm/year).
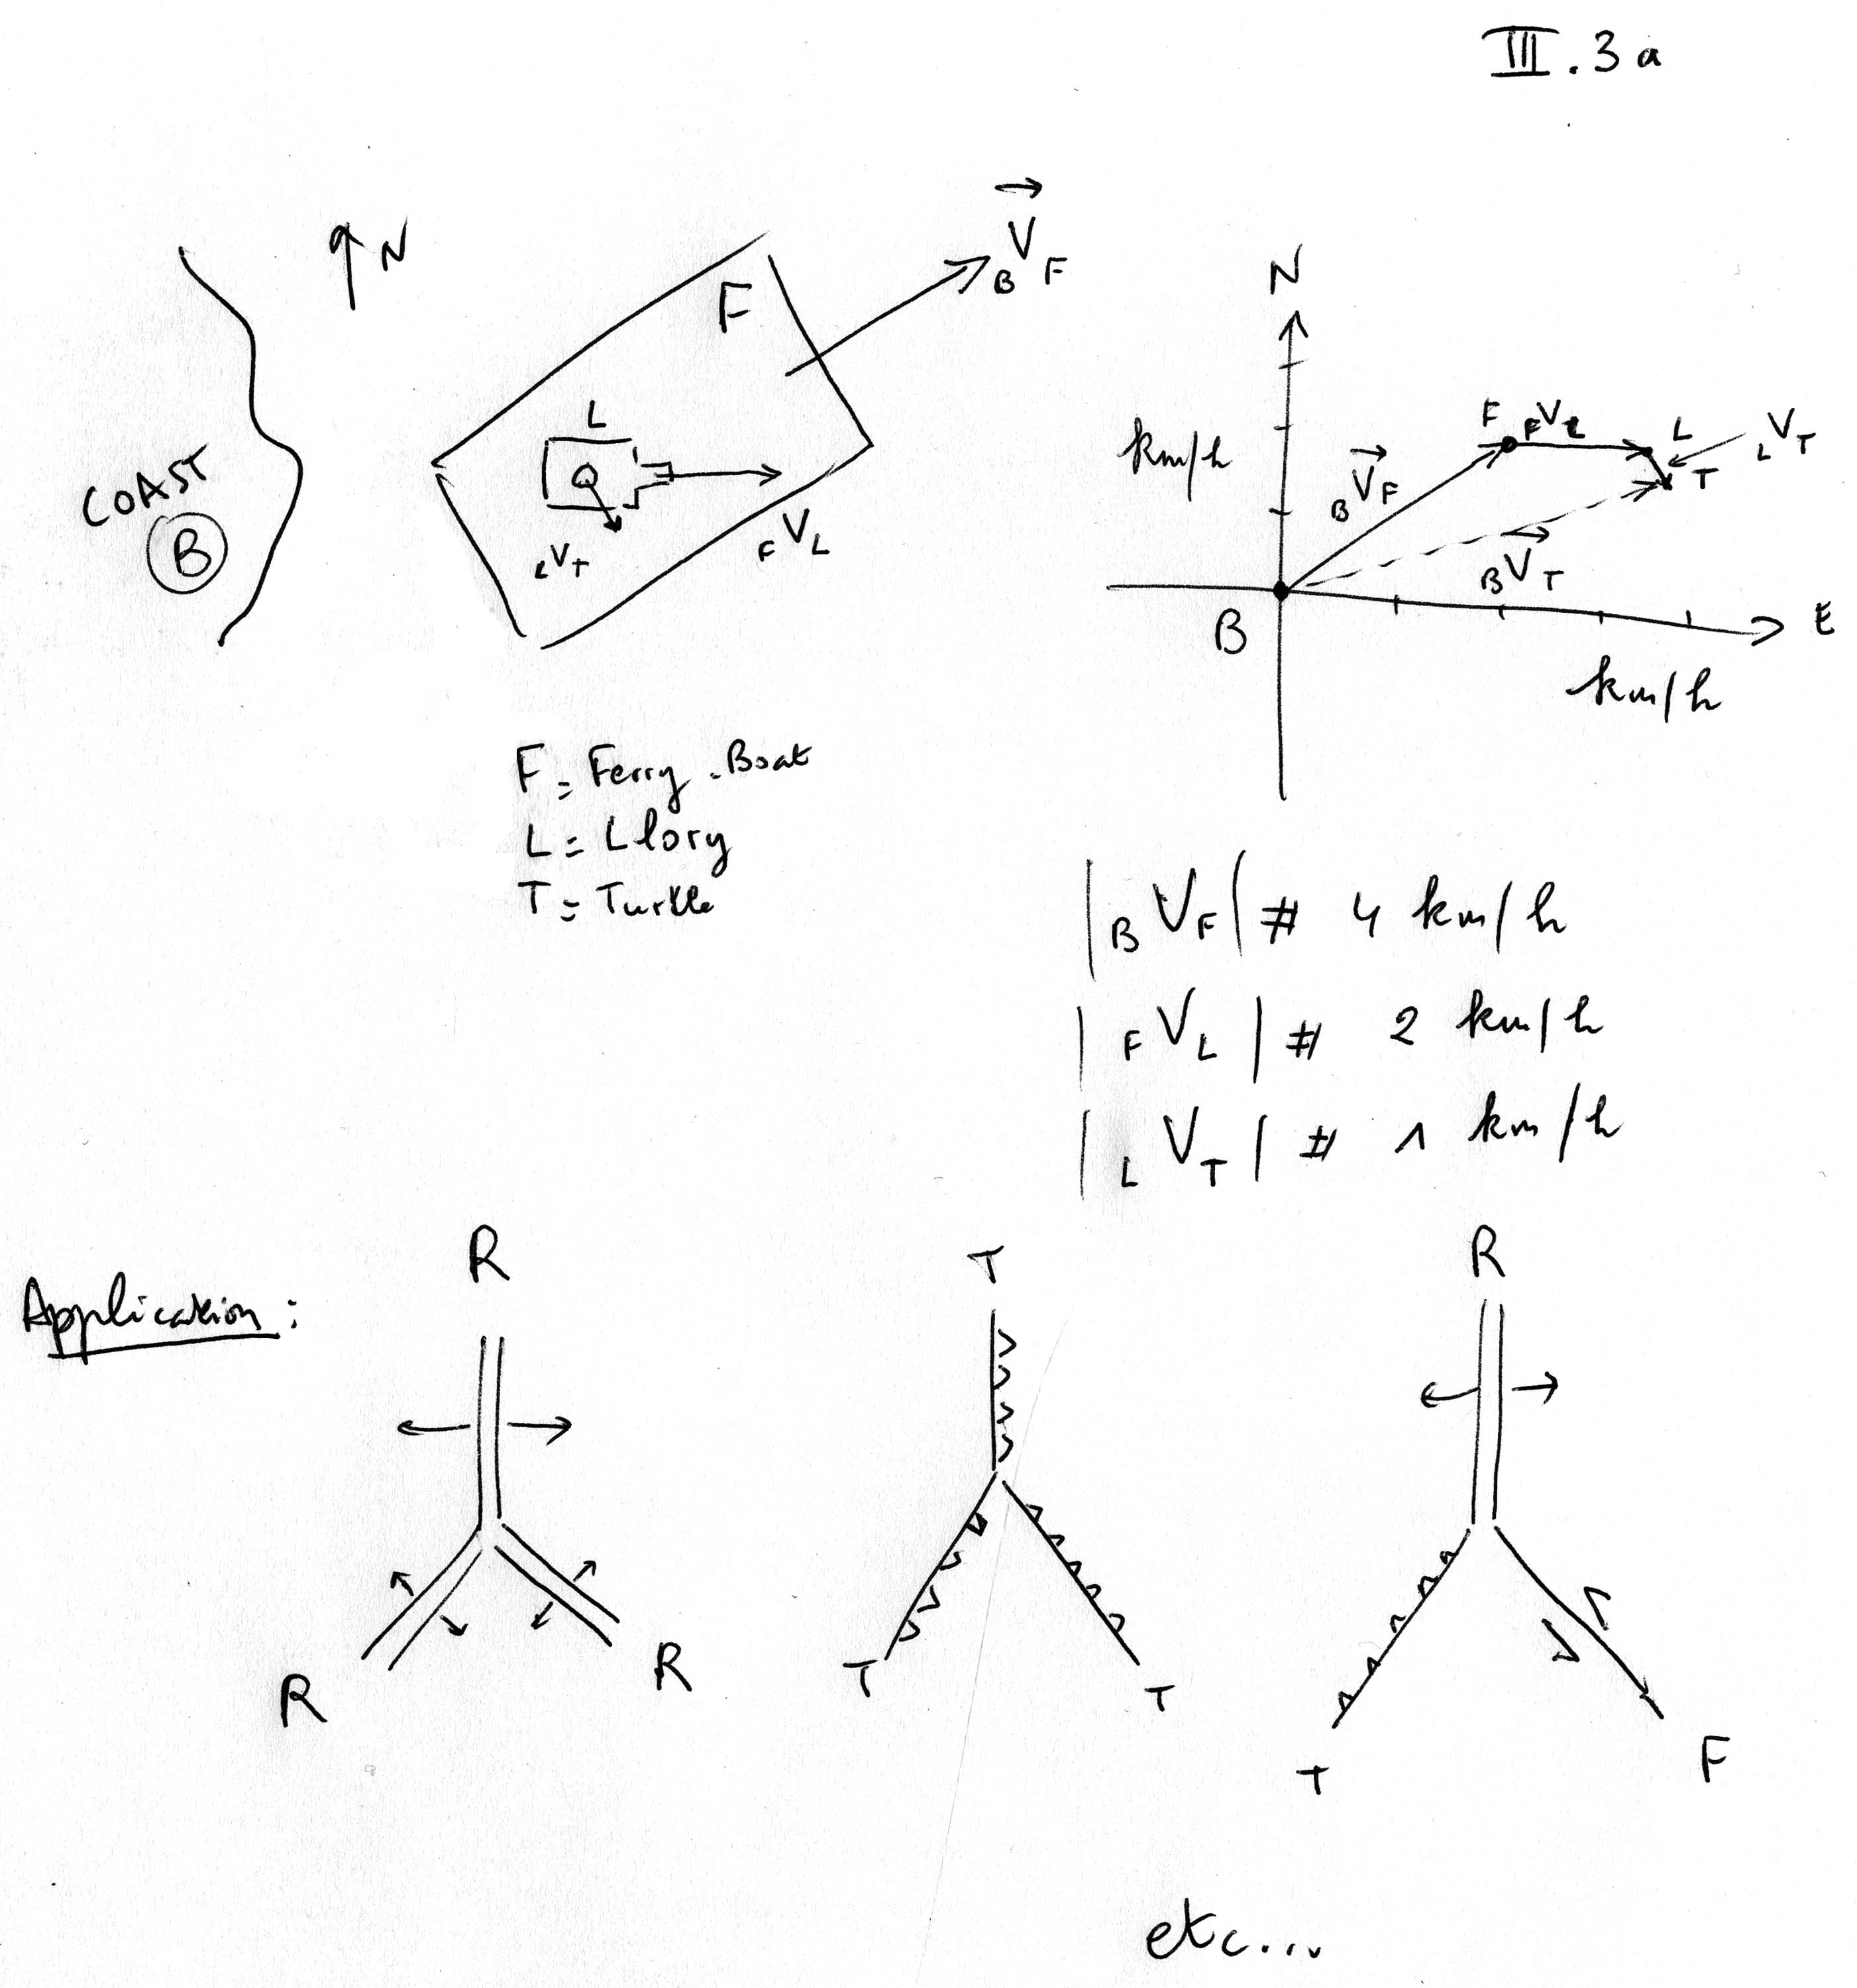
Velocity diagram : On a planar Earth : the velocity triangle (Figure) helps to determine de speed of vA/C knowing vA/B and vB/C.
However, since the Earth is not planar, spherical trigonometry is used to calculate these relative speeds on the sphere. Velocities are not translative vectors independent of their position on the sphere, they are linear velocities around an axis of rotation (also called Eulerian pole) having an angular velocity (Figure). Hence, close to the pole of rotation the velocity is minimum, and at 90° to the axis, the velocity is maximum. This results in the NUVEL-1 model (Table) giving the latitude and longitude of the Eulerian poles for pairs of plates.
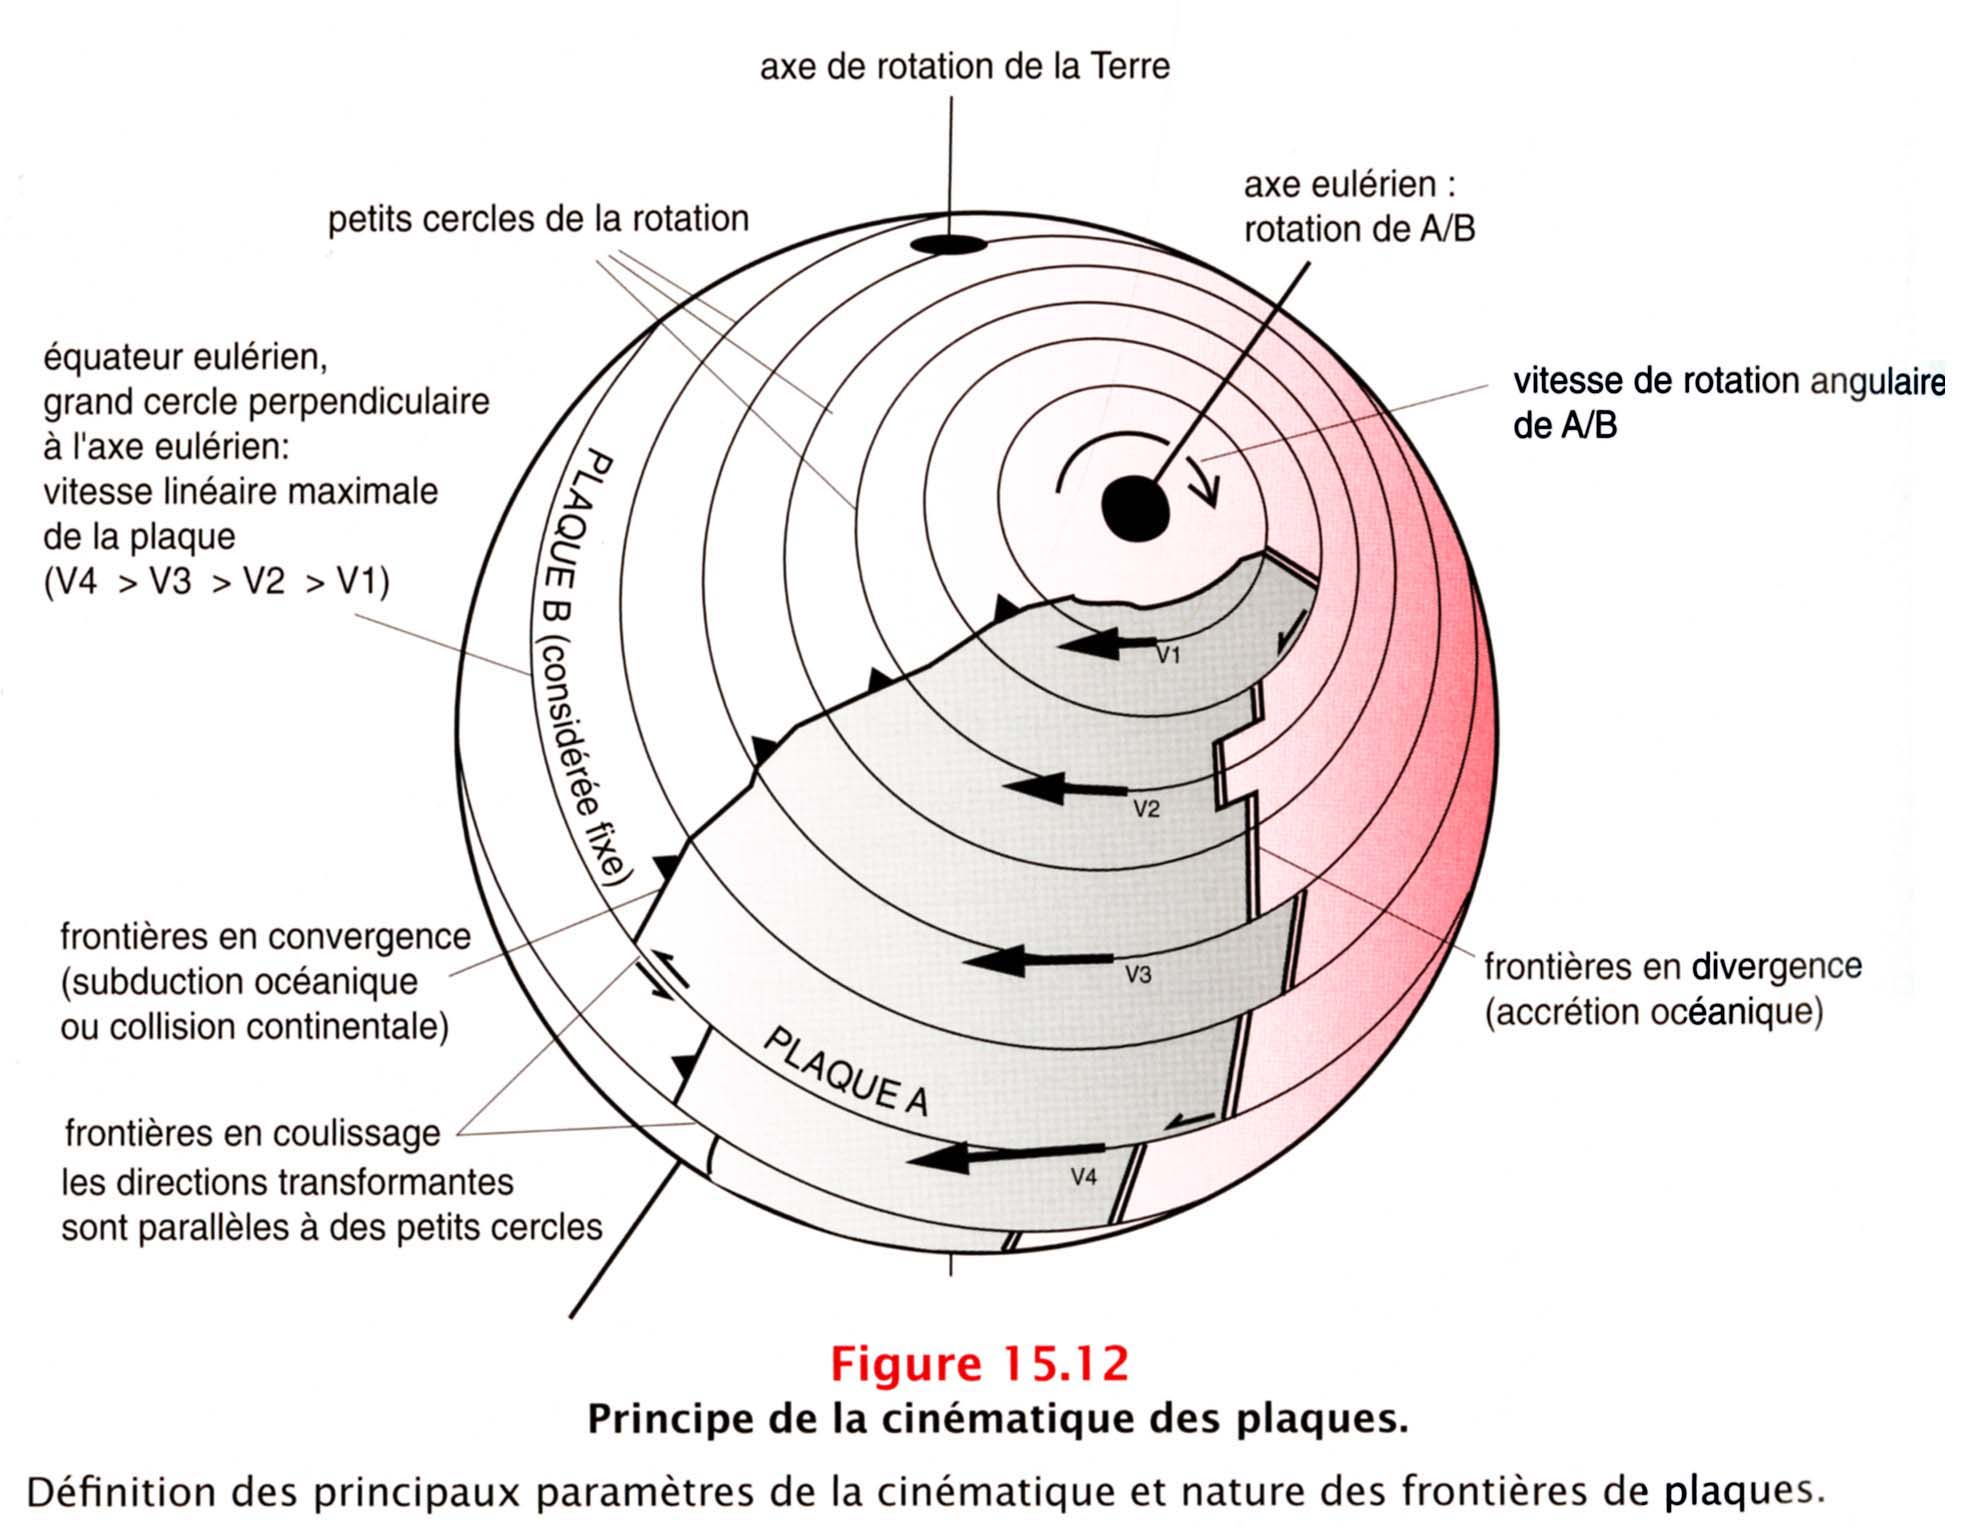
Caption : Principle of plate kinematics (the circles correspond to equal linear velocity lines around the eulerian axis of rotation between plates A and B).
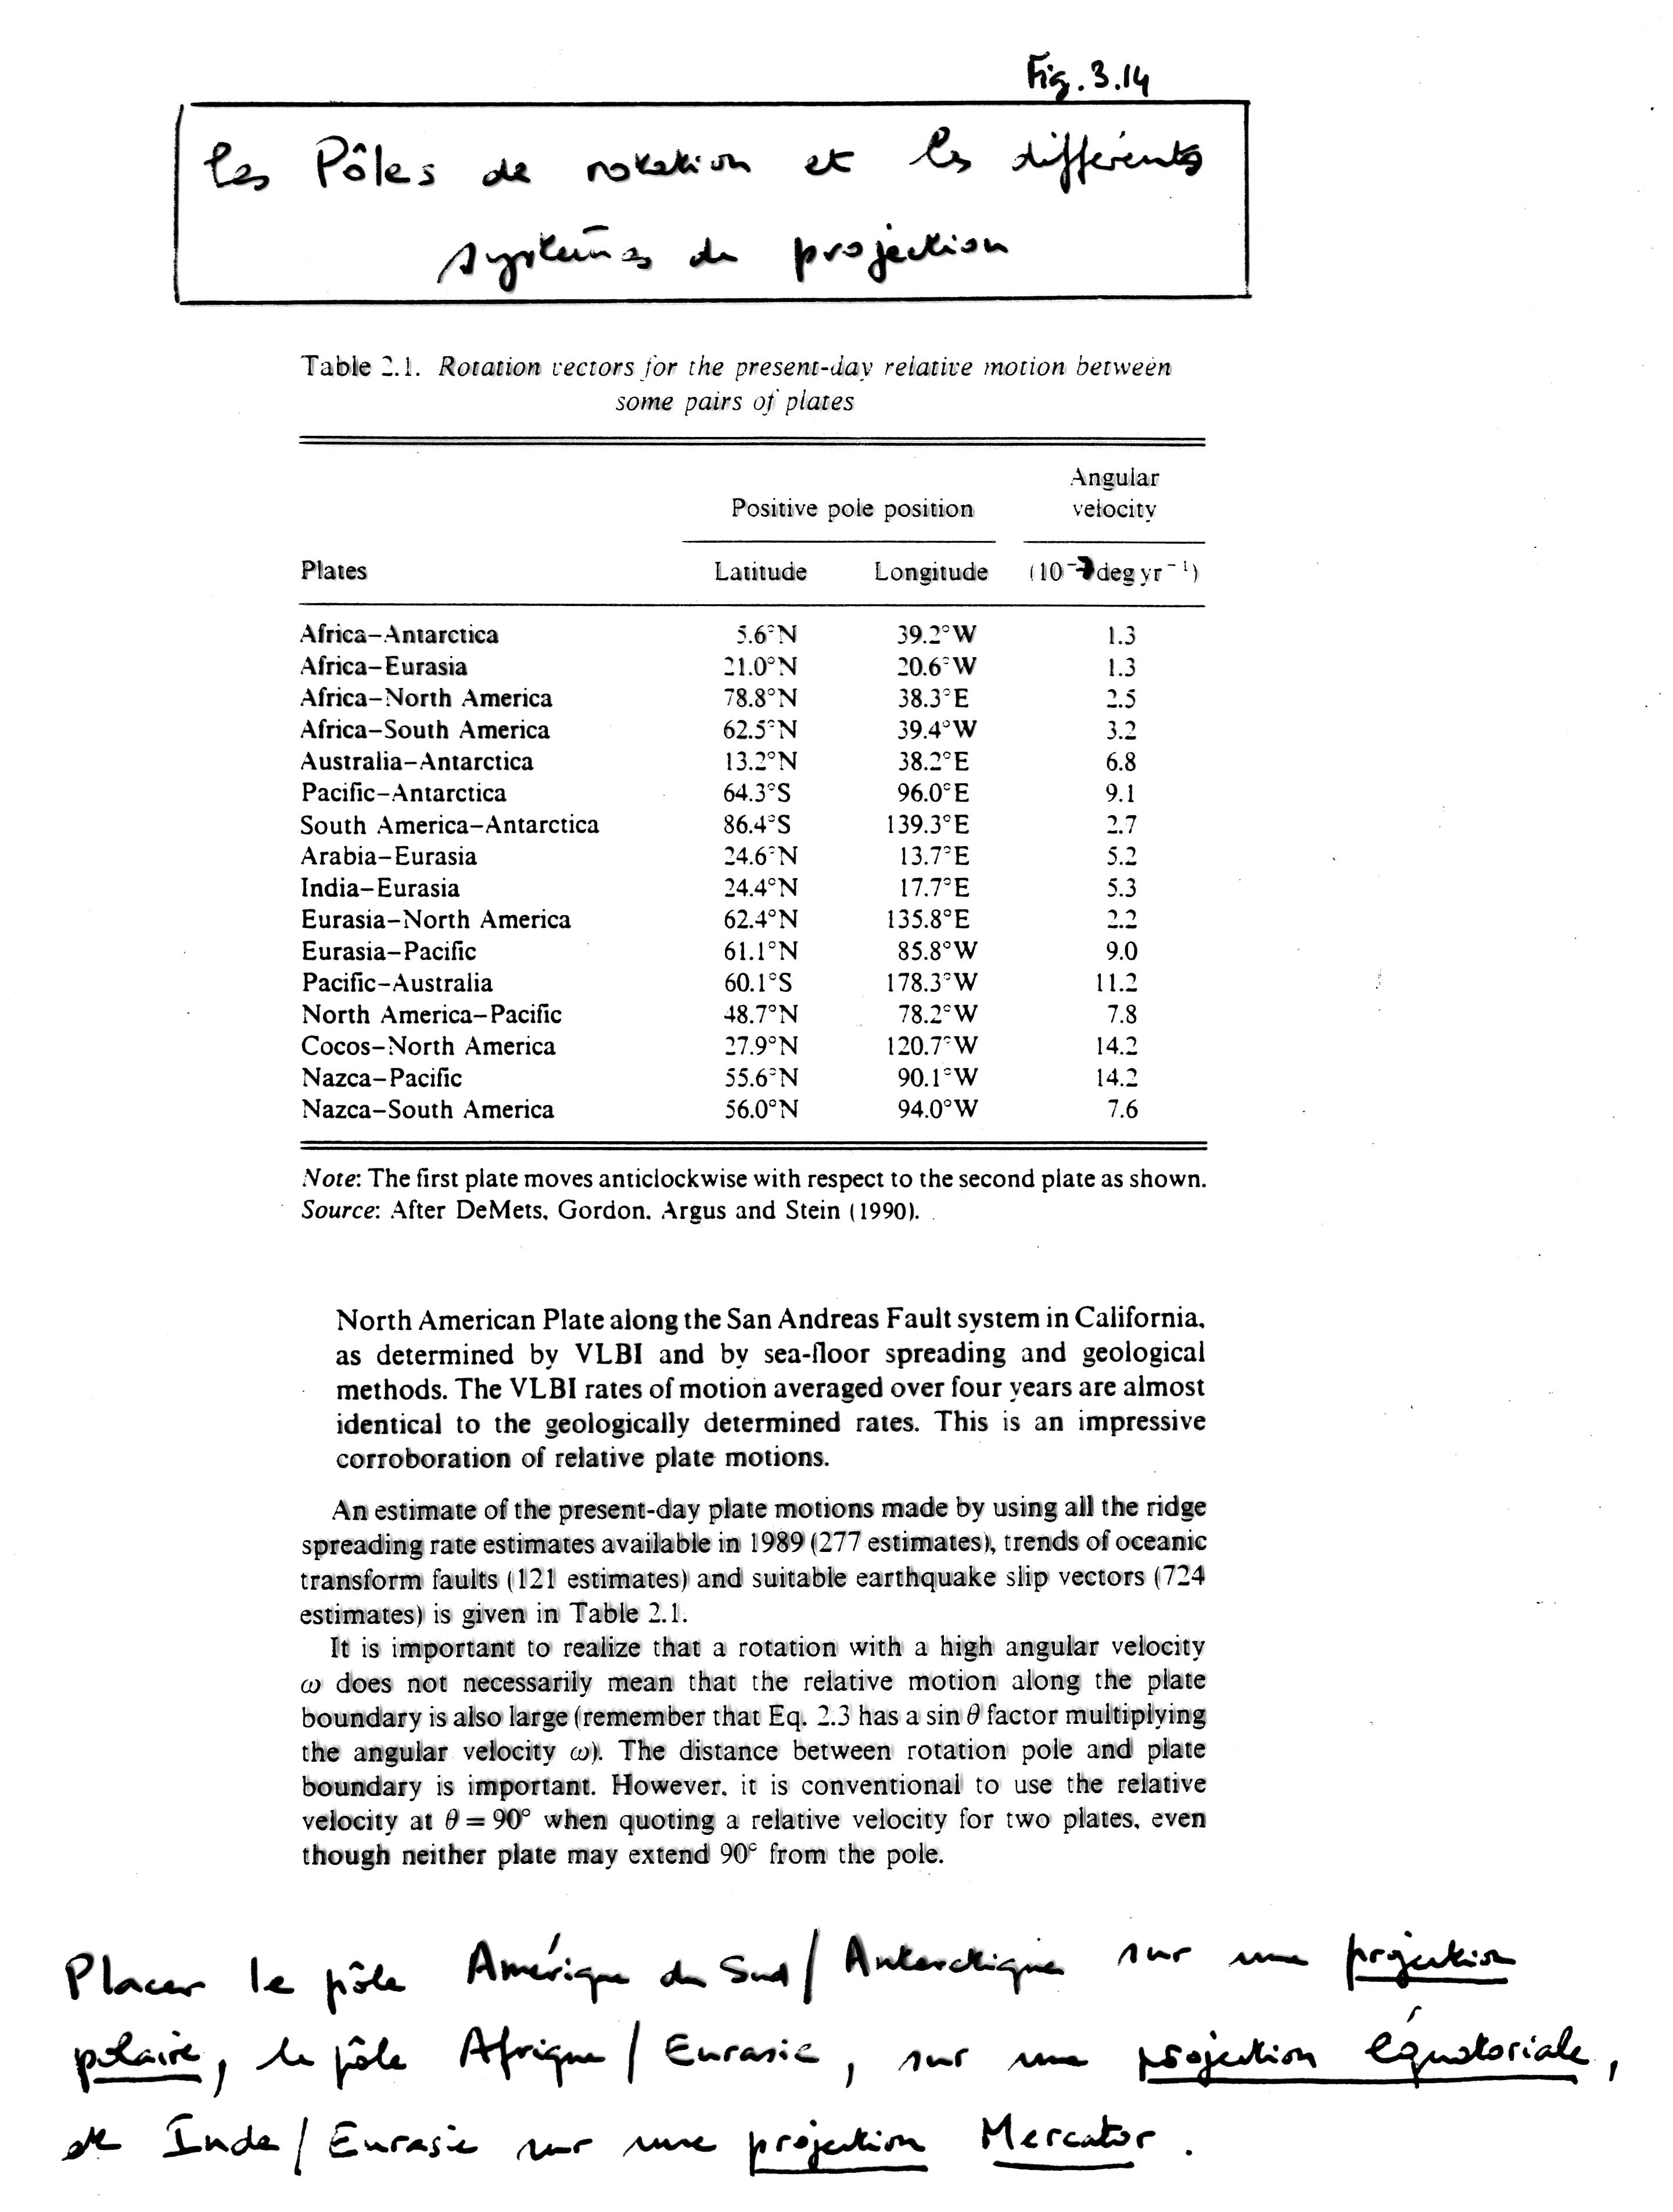
Positive pole positions and angular velocities for the principal pairs of plates according to the NUVEL-1 model.
Proposed exercice : place the pole South America/Antarctica in a polar projection, the pole Africa/Eurasia in a Mercator projection.
Corrected exercice : Plates and their boundaries over the world
Date: 2015-01-29; view: 2546
| <== previous page | | | next page ==> |
| Thermal profiles across a ridge, a trench and a transform fault | | | Subject: Methodology of FLT |