CATEGORIES:
BiologyChemistryConstructionCultureEcologyEconomyElectronicsFinanceGeographyHistoryInformaticsLawMathematicsMechanicsMedicineOtherPedagogyPhilosophyPhysicsPolicyPsychologySociologySportTourism
Supply Function. Change in quantity supplied and Change in supply
A supply functionis a model that represents the behavior of the producers and/or sellers in a market.
 QXS = fS(PX, PINPUTS, technology, number of sellers, laws, taxes, expectations . . . NS)
PX = price of the good,
PINPUTS = prices of the inputs (factors of production used)
Technology is the method of production (a production function),
laws and regulationsmay impose more costly methods of production
taxes and subsidies alter the costs of production
NS represents the number of sellers in the market.
Like the demand function, supply can be viewed from two perspectives:
Supply is a schedule of quantities that will be produced and offered for sale at a schedule of prices in a given time period, ceteris paribus. A supply function can be viewed as the minimum prices sellers are willing to accept for given quantities of output, ceteris paribus. Generally, it is assumed that there is a positive relationship between the price of the good and the quantity offered for sale.
A change in the price of the good (PX) will be reflected as a move along a upply function. A “change in quantity supplied is a movement along a supply function.” A shift of the supply function to the right will be called an increase in supply. This means that at each possible price, a greater quantity will be offered for sale. In an equation form, an increase in supply can be shown by an increase in the quantity intercept. A decrease in supply is a shift to the left; at each possible price a smaller quantity is offered for sale.
Market equilibrium
Equilibrium is “a state of rest or balance due to the equal action of opposing forces,” and “equal balance between any powers, influences, etc.”
 The New Palgrave: A Dictionary or Economics identifies 3 concepts of equilibrium:
– Equilibrium as a “balance of forces”
– Equilibrium as “a point from which there is no endogenous ‘tendency to change’”
– Equilibrium as an “outcome which any given economic process might be said to be ‘tending towards’, as in the idea that competitive processes tend to produce determinant outcomes”.
“equilibrium” is perceived as the condition where the quantity demanded is equal to the quantity supplied; the behavior of all potential buyers is coordinated with the behavior of all potential sellers. Graphically, economists represent a market equilibrium as the intersection of the demand and supply functions. At the equilibrium price the quantity that buyers are willing and able to buy is exactly the same as sellers are willing to produce and offer for sale.
There is an equilibrium price that equates or balances the amount that agents want to buy with the amount that is produced and offered for sale (at that price). There are no forces (from buyers or sellers) that will alter the equilibrium price or equilibrium quantity.
The process of achieving a state of equilibrium is based on buyers and sellers adjusting their behavior in response to prices, shortages and surpluses. If the price is “too high” – the market is not in equilibrium. The amount of the good that agents are willing and able to buy at this price (quantity demanded) is less than sellers would like to sell (quantity supplied). This is a surplus. In order to sell the surplus units, sellers lower their price. As the price falls the quantity supplied decreases and the quantity demanded increases. (Neither demand nor supply are changed.) As the price falls, the quantity supplied falls and the quantity demanded increases.
When the market price is below the equilibrium price the quantity demanded exceeds the quantity supplied. At the price below equilibrium, buyers are willing and able to purchase an amount that is greater than the suppliers produce and offer for sale. This is a shortage. The buyers will “bid up” the price by offering a higher price to get the quantity they want. The quantity demanded will fall while the quantity supplied rises in response to the higher price.

|
Consumer surplus is the excess of the benefit a consumer gains from purchases of goods over the amount paid for them. Grafically it can be shown as a triangle KEC. And mathematically it can be computed as an area of the KEC triangle.
Producer’s surplusmeans the excess of total sales revenue going to producers over the area under the supply curve for a good. Mathematically it can be computed as an area of the FEC triangle.
12 Market Adjustment to Change: shifts of Demand and shift of Supply
Market systems are favored by Neoclassical economists for three primary reasons. First, agents only need information about their own objectives and alternatives. The markets provide information to agents that may be used to identify and evaluate alternative choices that might be used to achieve objectives. Second, each agent acting in a market has incentives to react to the information provided. Third, given the information and incentives, agents within markets can adjust to changes. The process of market adjustment can be visualized as changes in demand and/or supply.
Shifts of Demand
 The demand function was defined from two perspectives:
- A schedule of quantities that individuals were willing and able to buy at a schedule of prices during a given period, ceteris paribus.
- The maximum prices that individuals are willing and able to pay for a schedule of quantities or a good during a given time period, ceteris paribus.
The demand function is perceived as a negative or inverse relationship between price and the quantity of a good that will be bought. The relationship between price and quantity is shaped by other factors or variables. The demand function was expressed:
Qx = fx(Px, Pc, Ps, M, Preferences, Nbuyers, . . . )
Pc is the price of complimentary goods. Ps is the price of substitutes. M is income. Such proxies as gender, age, ethnicity, religion, etc represent preferences. A change in these related variable will result in a shift of the demand function or a change in demand.
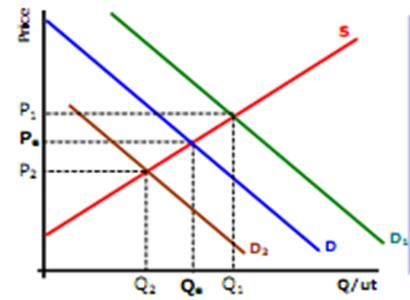
 If supply is constant, an increase in demand will result in an increase in both equilibrium price and quantity. A decrease in demand will cause both the equilibrium price and quantity to fall.
Shift of Supply
The supply function was expressed as Qxs = f(Px, Pinputs, Tech, regulations, N sellers, . . . NS),
A change in the price of the good changes the quantity supplied. A change in any of the other variables will shift the supply function.
An increase in supply can be visualized as a shift to the right, at each price a larger quantity is produced and offered for sale. A decrease in supply is a shift to the left; at each possible price a smaller quantity is offered for sale. If the supply shifts and demand remains constant, the equilibrium price and quantity will be altered.
Date: 2016-03-03; view: 2050
| <== previous page | | | next page ==> |
| Equilibrium analysis | | | Cobweb theorem as an illustration of stable and unstable equilibrium |