CATEGORIES:
BiologyChemistryConstructionCultureEcologyEconomyElectronicsFinanceGeographyHistoryInformaticsLawMathematicsMechanicsMedicineOtherPedagogyPhilosophyPhysicsPolicyPsychologySociologySportTourism
Which is most popular?
It depends on who you ask! There is no one who can accurately report the true usage of any operating system. Various companies can report what they sold in a particular period of time and combine that info to see their "market share". Internet sites can report the operating systems of those who come to visit them. Someone might be able to estimate the "installed base" for an operating system, meaning the number of computers currently using that operating system. But no one can really tally the whole world, or even a whole country.
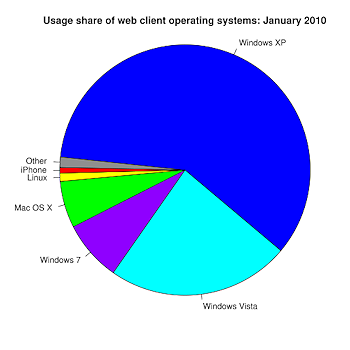
The pie chart below shows statistics in a Wikipedia article on operating systems as of January 2010.
The charts shows the median of values from several sources, all of which used data from web browser visits to web sites. This, of course, omits completely any computer that did not visit those sites. But it's the best we can do. Notice that iPhone and other mobile devices are included in Wikipedia's charts but are in separate charts for HitsLinks.com.
What trends do you see?
Wikipedia:
 Usage share of web client operating systems. Source: Median values from Usage share of operating systems Windows XP (58.64%) Windows Vista (23.25%) Windows 7 (7.70%) Mac OS X (5.12%) Linux (1.04%) iPhone (0.72%) Other (1.32%)
| 
|
Check the current numbers at http://en.wikipedia.org/wiki/Usage_share_of_operating_systems 
|
Hitslink.com:
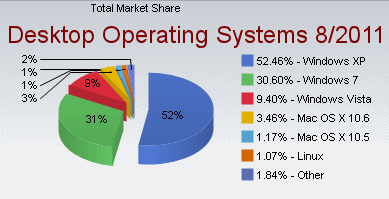
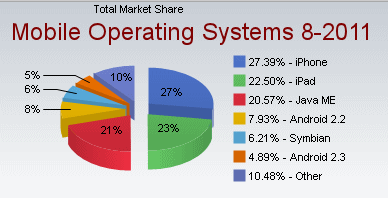
The next two pie charts are from a different source, HitsLink.com. Desktop computers and Mobile or Tablet devices use different operating systems. Check the current numbers by clicking the links below the charts. These charts show the various versions separately.


HitsLink.com:Desktop Operating Systems 
HitsLink.com:Mobile/Tablet Operating Systems 
Date: 2015-01-11; view: 5296
| <== previous page | | | next page ==> |
| Common Operating Systems for Desktop Computers | | | System Software: Utilities |