CATEGORIES:
BiologyChemistryConstructionCultureEcologyEconomyElectronicsFinanceGeographyHistoryInformaticsLawMathematicsMechanicsMedicineOtherPedagogyPhilosophyPhysicsPolicyPsychologySociologySportTourism
Explain the standard deviation of the mean
In statistics and probability theory, the standard deviation (SD) (represented by the Greek letter sigma, σ) measures the amount of variation or dispersion from the average.[1] A low standard deviation indicates that the data points tend to be very close to the mean (also called expected value); a high standard deviation indicates that the data points are spread out over a large range of values.
The standard deviation of a random variable, statistical population, data set, or probability distribution is the square root of its variance. It is algebraically simpler though in practice lessrobust than the average absolute deviation.[2][3] A useful property of the standard deviation is that, unlike the variance, it is expressed in the same units as the data. Note, however, that for measurements with percentage as the unit, the standard deviation will have percentage points as the unit.
In addition to expressing the variability of a population, the standard deviation is commonly used to measure confidence in statistical conclusions. For example, the margin of error in pollingdata is determined by calculating the expected standard deviation in the results if the same poll were to be conducted multiple times. The reported margin of error is typically about twice the standard deviation—the half-width of a 95 percent confidence interval. In science, researchers commonly report the standard deviation of experimental data, and only effects that fall much farther than two standard deviations away from what would have been expected are considered statistically significant—normal random error or variation in the measurements is in this way distinguished from causal variation. The standard deviation is also important in finance, where the standard deviation on the rate of return on an investment is a measure of thevolatility of the investment.
When only a sample of data from a population is available, the term standard deviation of the sample or sample standard deviation can refer to either the above-mentioned quantity as applied to those data or to a modified quantity that is a better estimate of the population standard deviation (the standard deviation of the entire population).
Let X be a random variable with mean value μ:

Here the operator E denotes the average or expected value of X. Then the standard deviation of X is the quantity
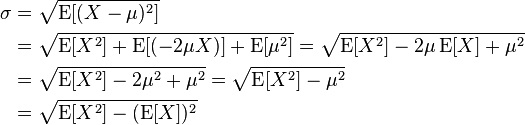
(derived using the properties of expected value).
In other words the standard deviation σ (sigma) is the square root of the variance of X; i.e., it is the square root of the average value of (X − μ)2.
Date: 2016-01-14; view: 1701
| <== previous page | | | next page ==> |
| What is the variance and the coefficient of variation | | | Give a definition for a T test, F test, G test. |