CATEGORIES:
BiologyChemistryConstructionCultureEcologyEconomyElectronicsFinanceGeographyHistoryInformaticsLawMathematicsMechanicsMedicineOtherPedagogyPhilosophyPhysicsPolicyPsychologySociologySportTourism
Experimental Uncertainties – Introduction to Kinematics and Calculus
1. A child drops a marble into a deep pool. After falling some distance, it attains a constant velocity, vt. At this velocity, the resistive force on the marble upwards is equal to the net downwards force on the marble. The terminal velocity vtis given by the equation:

where r is the radius of the marble, ρ is the density of the marble and η is the viscosity of water. Find a unit for η in terms of base units. (4 marks)
2. The time period of a simple pendulum of mass m and spring constant k is given by the equations:

Show that this expression is consistent with k being measured in Nm-1.  (4 marks)
3. a. Explain what it means to say that a physical equation is homogeneous.
b. Show that the equation below is homogeneous:
 (4 marks)
4. Explain the difference between a vector and a scalar. What is meant by the magnitude of a vector? Use a diagram to illustrate your answer. (4 marks)
5. Which of the following physical parameters are vectors: capacitance, displacement, electric field, mass, momentum, frequency, kinetic energy, weight? (4 marks)
6. Vector  is twice as long as vector
  , and the angle between both vectors is 45˚. Draw two vector diagrams to clearly show i)
  and ii)
  . (4 marks)
7. The vector  is added to the vector
  . What is the magnitude of the resultant vector? (4 marks)
8. A car has a velocity of 18.0 m s-1 due north. At a junction, its turns 90.0º to the left and its new velocity is 14.0 m s-1.
a. Draw a vector diagram to show the initial and final velocities and the change in velocity
b. Calculate the change in speed
c. Calculate the change in velocity (6 marks)
9. A river flows from west to east at 3.00 km h-1. Two athletic teenagers, Harry and Jack, leave a point O on the river’s south bank simultaneously. Harry canoes such that his actual motion is due north at 6.00 km h-1. Jack runs east, along the river at 10.0 km h-1.
Use clearly labelled vector diagrams to find the speed, in km h-1, and direction of Harry
a. relative to Jack
b. relative to the water (6 marks)
10. Two coplanar forces A and B act at a point O, as shown in the figure below (in Newtons). Calculate the component of the resultant force
a. along OX
b. along OY
c. the magnitude and direction of the resultant force.
(6 marks)
11. What is the resultant force for the vectors shown?
(4 marks)
(Total: 50 marks)
Experimental Uncertainties – Introduction to Kinematics and Calculus
1.The voltage V across an unknown resistor is found to be 10.0 ± 0.1 V and the current I passing through it is found to be 214 ± 5 mA. Calculate the value of the resistance and its error. (4 marks)
2.In an experiment to determine the density of aluminium it is found that a cylindrical block of aluminium has a radius of 3.0 ± 0.1 cm, a height of 6.0 ± 0.2 cm and a mass of 460 ± 5 g. Calculate the density of aluminium and the uncertainty in its value according to this experiment. Express your answer in SI units and use scientific notation. (4 marks)
3.A simple pendulum experiment was used to determine the acceleration due to gravity, g. The following values were obtained for the time of 10 oscillations of the pendulum:
22.3 s, 22.2 s, 22.6 s, 22.1 s, 21.9 s, 27.5 s, 22.4 s
The length L of the pendulum was estimated to be 108.45 cm when measured using a ruler on which the smallest division is 1 mm. After removing any potential outlier, use the data above to obtain the value of g according to this experiment. Your answer should include the experimental error. Comment on whether there appears to be a systematic error in this experiment. (The expression for the period T of a simple pendulum is  ) (6 marks)
4.The period T of a compound pendulum is measured as a function of h, the distance of the pivot from the centre of gravity. The theoretical relationship between T and h is given by:
 ,
,
where k is a constant and g is the acceleration due to gravity.
a) What is the dimension of k?
b) What should be plotted on the x and y axes in order to obtain a straight line graph from which it is possible to obtain the values of k and g? Express the gradient of this graph in terms of g. (4 marks)
5. The average time to failure (F) of an integrated circuit obeys a law of the following form:
 ,
,
where C and T0 are constants and T is the operating temperature. What would you plot on the x and y axes so that you obtain a straight line graph from which T0 and C can be determined? (4 marks)
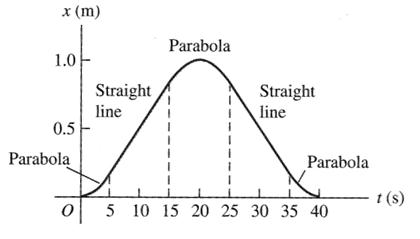
6. Fig. 1 shows a graph of the position of a spider crawling along the x-axis.
a) Draw two diagrams to show the shape of the spider’s velocity and acceleration as a function of time. Assume that initially the spider is at rest.
b) Estimate the total distance travelled by the spider from time t = 0 s to 40 s. (4 marks)
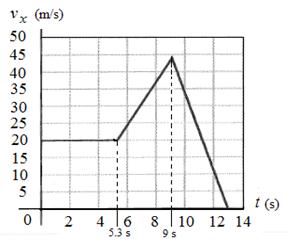
7. Fig. 2 shows the velocity of a motorcyclist plotted as a function of time.
a) Find the instantaneous acceleration at t = 3 s, t = 7 s, t = 10 s.
b) Which part of this graph represents the distance travelled by the motorcyclist?
c) How far approximately does the motorcyclist travel during the first 9 s? (6 marks)
|
|
8. A top secret supersonic rocket can achieve a maximum speed equal to three times the speed of sound in air (which is approximately 340.2 ms-1). When flying horizontally the distance x (in m) it travels as a function of time t (in s) can be modelled by the equation:
x(t) = 227t 3/ 2 – 14.2t 2
a) Find the time taken for the rocket to reach its approximate maximum speed.
b) Calculate the distance x the rocket has travelled from t = 0 until it reaches its maximum speed.
c) Find the time when the speed of the rocket becomes zero again.
d) By considering the answers to a), b) and c) draw a rough sketch of the velocity of the rocket versus time showing clearly the maximum and zero points on the graph.
e) Without using integration, calculate the numerical value of the area under the graph and above the x-axis. (10 marks)
9. Fig. 3 shows the acceleration of a model railroad locomotive moving on the x-axis. Sketch its velocity vx and x-coordinate as a function of time, if x = 0 m and vx = 0 m/s at t = 0 s.
|
 (6 marks)
(Total: 48 marks)
Date: 2014-12-29; view: 1665
| <== previous page | | | next page ==> |
| UNITS AND DIMENSIONS. VECTORS AND SCALARS. | | | Dahl Roald - Charlie and the Chocolate Factory |