CATEGORIES:
BiologyChemistryConstructionCultureEcologyEconomyElectronicsFinanceGeographyHistoryInformaticsLawMathematicsMechanicsMedicineOtherPedagogyPhilosophyPhysicsPolicyPsychologySociologySportTourism
The Importance of Timing

|
I have already discussed how to determine the right place for entering the market and how to use the market fluctuations. Now, it’s time to talk about the timing factor. As the market events develop (not only in space, but also in time), it is necessary to take into account the entire picture at any mo- ment a position is opened or liquidated. Timing is an extremely important factor in trading, and a sense of timing is an essential component of a trader’s success in the market. The right choice of timing for position open- ing and liquidation is a very complicated task and demands a lot of atten- tion, patience, and (unfortunately) rather significant experience of a trader.
Thus, positions opened in the direction of particular market move- ment—at the moment when the market forms new high or low of the day— will give a trader some certain statistical advantage. This is especially true when the market simply doesn’t have enough time to complete its average daily range within the period of time left before the end of a trading day.
Normally, it wouldn’t be very difficult for an experienced technical trader to determine future market trading levels more or less precisely, but the forecast of the time frame of such an event is rather difficult if not impos- sible. Mistakes in precise forecasting are so great that they often compel a trader either to liquidate a potentially very promising position prematurely, or to keep a profitable position longer than necessary. An unprofitable posi- tion carried with a floating loss is often liquidated at the moment it has accu- mulated the greatest possible loss and right before a turn for the better.
However, the connection between amplitude of the market fluctua- tions and its direction also exists, and the knowledge of some common law related to timing could essentially help a trader in his choice of the right place at the right time. Besides, because the market is open 24 hours a day, it is quite natural that a trader is not capable of supervising it con- stantly. Hence, it is necessary to organize his working hours so that pres- ence in the market would coincide with periods of the best activity and would bring a maximum possible effect. For these purposes, it is impor- tant to have an idea of how time and market space are tied together.
The market has to complete its average trading range daily. So, the distance between high and low of each next day can be projected in ad- vance with certain accuracy.
This statement is one of the basic three postulates of my trading method. It is time to talk about it in more detail, because this fact has a di- rect relation to intraday speculative trade, and some of my trading tem- plates are constructed on its basis.
Really, this feature of the market rather rigidly connects space and time. If you take into the account the inertia of the market, such an approach will allow you to more effectively determine the levels of opening and liquidating your positions, and to make these transactions at the right time.
Thus, the positions opened in the direction of the current market move- ment at the moment when the market forms new High or Low of the day will give traders some certain statistical advantage. This is especially true when the market simply doesn’t have enough time to complete its average daily range within the period of time left before the end of a trading day.
To execute the order to open a new position, I typically use entry stops so as not to waste time on transaction execution while trying to place my order at a market price. Generally, such tactics works very well because, at the expense of stops accumulation, the market frequently ac- celerates at the moment of establishing a new daily High or Low.
This trading tactic is very effective when:
• Trading is made at a period of the best activity of the market.
• The currency chosen for trade has the largest average daily range.
• The position opens in a direction of the current intermediate trend.
• The establishment of new high or low coincides with a break of an im- portant technical level.
• There is not enough time left until the end of the trading day, and the average minimum range typical for the given currency hasn’t yet been formed.
The last item is especially interesting to traders, because it gives them a statistically advantageous position. The described situation hardly in-
creases chances for taking profit, but at the same time allows the trader to calculate a point of the position liquidation. The position may be closed at the moment when the market achieves the average range in which it can liquidate your position, or it may be saved until the end of the day and be liquidated directly before closing of the market. In the second case, the in- traday profit is frequently more significant, because the market often ex- ceeds the minimum of its daytime range.
| CYCLIC CHANGES IN MARKET ACTIVITY PERIODS | ||
I have witnessed many similar cycles when, almost every day, not only USD/JPY but also USD/CHF, USD/DEM, and Cable formed their daily trad- ing range during a single market session. Long-term supervision of the market has allowed me to determine some other laws having a direct rela- tion to timing. These laws are considerably more important for a short- term trade than for a positional one. The intraday trade is most subject to influence of timing, and requires application of various trading tactics, de- pending on the moment of opening or liquidating a position.
From the start, I would like you to pay attention to the periodically varying character of market behavior. Activity of the market and an intra- day trading range are not coordinated. Changes in market activity occur cyclically. They are characterized by displacement of periods of the in- creased and decreased activity on a 24-hour scale of a trading day during many consecutive days. For example, there have been cycles in which the daily trading range was completed in a period of one working session. For example, the daily range completion during the limited time is character- ized by forming the top and bottom of the whole day during one of three basic sessions: Asian, European, or New York. It means that the high and low of the trading day were formed in no more than eight hours, and, for the rest of the trading day, the market was moving inside the already formed range.
Sometimes, these cycles are highly visible, and sometimes they are less obvious. Their variety is huge. From that great number of various cy- cles that I had to observe while trading the basic currencies, the following were the most memorable:
• The market formed its daily range during a single session. See Figures
16.1 a, b, and c.
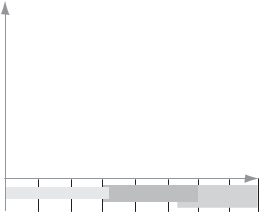
• Directly before the New York session (10 to 20 minutes prior to its be- ginning), the market formed the top or bottom of the daily range. For example, within the time left until the end of the day, the market traded inside the already formed range. See Figure 16.2.
 High
High
Open Average daily range
Low
Asian session European session NY session
a
21 0 3 6 9 12 15 18 21
 GMT
GMT
High
Average daily range
Open
Low
Asian session European session NY session
b
21 0 3 6 9 12 15 18 21
 GMT
GMT
 High
High
Average daily range
Open
Low
Asian session European session NY session
c
21 0 3 6 9 12 15 18 21
GMT
FIGURE 16.1 Single session market activity (a—Asian, b–European, c—North
American).
 High
High
Average daily range
Open
Low
Asian session European session NY session
21 0 3 6 9 12 15 18 21
GMT
 FIGURE 16.2
• The daily range activity was divided between sessions, and, during each session, the market expanded the previous range by 1/3 the size of the daily range in one direction or the other. See Figure 16.3.
• The market completely formed its daily range by the end of the Euro- pean trading session, and traded inside the already formed range for the rest of the day. See Figure 16.4.
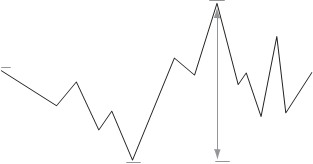
• Within three hours before the end of the European session, the mar- ket almost doubled its trading range. See Figure 16.5.
• The market completely formed its daily range within three to four hours, and then traded only inside the already formed range. See Fig- ure 16.6.
• The market increased its daily range significantly (40-60%) in an un- usual time of the trading day, i.e., in a period between 3 to 5 P.M. NY time (8 to 10 P.M. GMT). See Figure 16.7.
These figures illustrate different market patterns in their relation to time matters. As you know, timing is a very important issue in the art of trading, and the ability to identify frequently changing behavioral market cycles can be helpful to a trader.
There were still a great number of other cycles of market activity, and all these possible variations cannot be listed. Because we can identify
High
Open
Average daily range
Low
Asian session European session NY session
21 0 3 6 9 12 15 18 21
GMT
 FIGURE 16.3
 High
High
Open
Low
Asian session European session NY session
21 0 3 6 9 12 15 18 21
GMT
 FIGURE 16.4
 Average daily range
High
Open
Low
Asian session European session NY session
21 0 3 6 9 12 15 18 21
GMT
 FIGURE 16.5
 High
High
Open
Average daily range
Low
Asian session European session NY session
21 0 3 6 9 12 15 18 21
GMT
 FIGURE 16.6
40%–60% of a daily range increase
Open
Asian session European session NY session
21 0 3 6 9 12 15 18 21
GMT
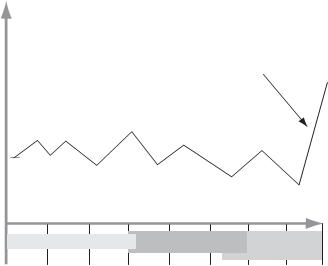 FIGURE 16.7
such cycles, we have a perfect opportunity to make a much more exact probability evaluation of the market movement during the following pe- riod of time in one direction or the other direction; and to reasonably plan a trader’s time. As a trader discovers this regularity, it allows him to change the schedule of his presence in the market, avoiding periods of lowered activity and participating in high amplitude fluctuations. Some cyclic laws even allow you to trade automatically by placing preliminary stops and limits at certain established price levels.
Unfortunately, it is impossible to forecast the end of one cycle and the start of a new one, and also changes in market behavior. There could be many variations, and all of them can be characterized typically by one or several distinctive features. There are common periods of increased and decreased activity, and some similarity in a sequence of intraday fluctua- tions during all the cycles. Because such cycles basically last from several weeks to several months, the trader almost always has enough time not only to identify change in character of market behavior but also to use them in full measure for reception of the maximum profit. I try to reach the optimum trading results by selecting appropriate trading templates from my standard set and adjusting them to a current situation. The ad- justment usually occurs at the moment of opening a new position on a timing scale inside one trading day.
CHAPTER 17
Date: 2015-12-17; view: 1394
| <== previous page | | | next page ==> |
| For a Reversed Position | | | Trading Strategy During the Central Bank Intervention |