CATEGORIES:
BiologyChemistryConstructionCultureEcologyEconomyElectronicsFinanceGeographyHistoryInformaticsLawMathematicsMechanicsMedicineOtherPedagogyPhilosophyPhysicsPolicyPsychologySociologySportTourism
Advanced instrumental analysis
 |
|
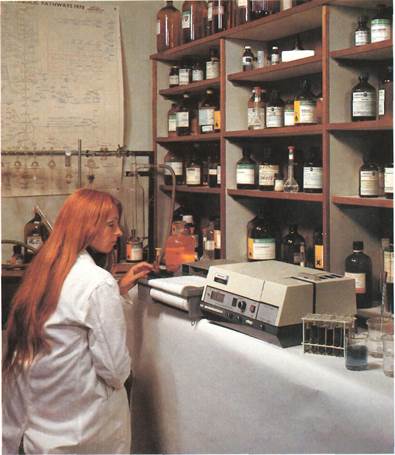
A spectrophotometer
(below) measures concentrations by comparing the optical density of a liquid sample with that of a solution of known concentration. More recent computerized machines can display information as "three-dimensional" colored graphics (below right).
Recent developments in electronics and new materials have led to a number of advanced analytical instruments and procedures.
Mass spectrometry
Ifchemical compounds are bombarded in a vacuum with streams of electrons or highly concentrated light beams from a laser, certain changes occur. Some molecules in the compounds lose electrons and form positively charged ions (cations). An ion is an atom or group of atoms that carries an electrical charge. Other molecules are broken down into smaller fragments that also carry positive charges. The overall result is that each molecular species gives rise to a series of positively charged ions. These are characteristic of the original compound and can be used for its identification.
Mass spectrometry is the name given to the study of these ions. They may be separated from each other and measured in an instrument called a mass spectrometer. There are various forms of mass spectrometer. The most common consists of a powerful magnetic field into which the fragments of the bombarded molecules are directed. Within the field, the different ions follow individual paths related to their mass. By varying the strength of the magnetic field, the ions are brought to focus separately on a machine called an electron multiplier detector. The mass spectrum of a
compound consists of a series of peaks that differ in height. These differences depend on the relative numbers of ions of different mass values. On each spectrum, the highest peak usually corresponds to the mass of the positive ion of the compound itself. The rest of the spectrum has peaks obtained from progressively smaller and smaller fragments.
Compounds can be identified from their mass spectra by the shape and distribution of the various peaks. The fragmentation of similar molecules follows a pattern. Some chemical groupings are even more readily detached than others. The loss of such groupings in the molecules can also be an aid to identification.
Surface analysis
A variety of instrumental procedures has been developed for investigating the surfaces of materials or thin films deposited on other solids. They are of considerable importance for the detailed and accurate study of catalysts, oxidation of surfaces, and rates of corrosion. Catalysts are substances that cause chemical changes without themselves being changed. Oxidation is the chemical bonding of oxygen with a substance. Corrosion refers to the wearing or eating away of a substance. All of the methods depend on the impact of various beams of energy on the surfaces. The particles or energy released by the beam are also measured. The activating beam may consist of electromagnetic radiation, ions, electrons, orX rays. The type of beam depends upon the depth of surface to be examined. Low-energy electrons, for example, penetrate only very short distances. X rays are used for greater depth studies. Such techniques have made it possible to examine surfaces to a depth of less than one micron (one thousandth of a millimeter).
These methods of investigation are used to show how surface layers of materials differ from the layers underneath. The methods can also reveal the lack of uniform distribution of metals in alloys and sprayed coatings.

Analytical chemistry: Advanced instrumental analysis 133

|
| Deflector plates |
In a focusing mass spectrograph,a beam of positively charged ions (the ion beam) is deflected by curved electrically charged plates. It is then further deflected and focused by a magnetic field. Ions of different masses come to a focus in slightly different places. They can be recorded on a photographic plate. Here, they are collected as an electric current that is then amplified and plotted by a chart recorder or computer screen. The mass spectrogram produced takes the form of a bar chart (as shown below). It relates the intensity—that is, abundance—of particular ions to their mass-to-charge ratio Im/e).
 | |||||
 | |||||
 |
| [CH3 [CH3 |
| mle |
| The mass spectrogramof bromomethane (CH3Br) reveals that the bromine in the compound exists as a nearly equal mixture of two isotopes of atomic masses 79 and 81. |
Date: 2015-12-11; view: 1825
| <== previous page | | | next page ==> |
| Emission spectroscopy and atomic absorption | | | Radiochemical analysis |