CATEGORIES:
BiologyChemistryConstructionCultureEcologyEconomyElectronicsFinanceGeographyHistoryInformaticsLawMathematicsMechanicsMedicineOtherPedagogyPhilosophyPhysicsPolicyPsychologySociologySportTourism
Measuring Education
In Sociology we measure two distinct types of educational accomplishments: Educational Attainment is the number of years of school completed and Educational Achievement refers to how much the student has learned in terms of reading, writing, and arithmetic. Look at Table 1 to see how attainment typically correlates with degrees.
Table 1: Years of Schooling and Typical Degrees Associated with Them
| Years | Typical Degree |
| <12 | Drop out |
| High School | |
| Vocational Certificate | |
| Associates | |
| Bachelor’s | |
| Masters | |
| Doctorate (Ph.D.; Ed.D. ; JD,; or MD) | |
| 21+ | Specialization or Post-doctoral education |
*Extracted from Jason Amos, (August 2008) Dropouts, Diplomas, and Dollars: US High Schools and the Nation’s Economy taken from Internet on 24 March 2009 from http://www.all4ed.org/files/Econ2008.pdfAll4edu funded by Bill and Malinda gates Foundation.
Table 2 also shows the levels of income typically associated with these typical degrees. The difference between high school dropouts and graduates is about $8,100/year more for graduates or on a 35-year career in the labor force at least $283,500 more money earned by graduates. What would a 4-year Bachelor’s degree add per year? $19,400 per year for Bachelor’s grads compared to high school grads or $679,000 in 35 years of career work. A 4-year degree is financially well worth it.
Table 2: Degrees and Median Incomes Associated with Them*
| Degrees | Median Yearly Incomes |
| Drop out | $ 23,400 |
| High School | $ 31,500 |
| Vocational Certificate | $ 37,100 |
| Associates | $ 40,000 |
| Bachelor’s | $ 50,900 |
| Masters | $ 61,300 |
| Doctorate (Ph.D.; Ed.D. ; JD,; or MD) | $ 79,400 |
| Specialization or Post-doctoral education | $100,000+ |
*Extracted from Baum and May (2007) Figure 1.1 Median Earnings and Tax Payments of Full-time Year-Round Workers Ages 25 and Older by education Level, 2005
When students ask me how I feel about taking out student loans I explain the following to them. If you choose to go to college and forfeit full-time wages to become a full-time student you will lose about $126,000 of lost wages while in college. Plus it might cost you another $25,000 in student loans or expenses. So you could conclude that it cost you about $151,000 to earn a 4-year degree. Subtract that $151,000 from the extra $697,000 and you end up a $546,000 net increase in career earnings even accounting for missed wages and student loan expenses. So going to college pays, but how does dropping out of high school affect individuals and society?
The worst possible scenario in terms of work and lifestyle is to drop out of high school. And millions drop out each year in the US. Table 3 shows the dropout rates by racial classification for the US. By far, Asians Americans dropout the least at only 18.7 percent, followed closely by Whites at 22.4 percent. Hispanics, African Americans and Native Americans each have over 40 percent dropout rates—all that income lost; all that lifestyle forfeit; and all those other benefits of higher education missed.
Table 3: Dropout rates by Racial Classification in The United States 2007*
| Racial Classification | Percent Dropping Out of High School |
| Native American | 49.4% |
| African American | 44.7% |
| Hispanic | 42.2% |
| White | 22.4% |
| Asian American | 18.7% |
*Extracted from Jason Amos, (August 2008) Dropouts, Diplomas, and Dollars: US High Schools and the Nation’s Economy taken from Internet on 24 March 2009 from http://www.all4ed.org/files/Econ2008.pdfAll4edu funded by Bill and Malinda gates Foundation.
Jason Amos (2008) in his study of US dropouts also stated that:
“Individuals who fail to earn a high school diploma are at a great disadvantage, and not only when it comes to finding good-paying jobs. They are also generally less healthy and die earlier, are more likely to become parents when very young, are more at risk of tangling with the criminal justice system, and are more likely to need social welfare assistance. Even more tragic, their children are more likely to become high school dropouts themselves, as are their children’s children, and so on, in a possibly endless cycle of poverty (page 7).”

Truly this is an accurate statement. The US has some of the best educational opportunities for average children to acquire a good public education. But, it lacks cultural motivations that translate across racial and ethnic lines in such a way that education become valued and pursued by average children as a way of opening doors and improving life chances for themselves and their families. It is a paradox in the context of Weber’s life chances, because so many life chances are readily available to average people. Yet, they are refused or ignored by millions.
Amos (2008) also pointed out that high school dropouts from the Class of 2008 will lose $318,000,000,000 in lost lifetime earnings. They will be more likely to be arrested and use welfare for another combined cost of $25,000,000,000 to local and state agencies (page 8). The billions of lost earnings and judicial and welfare costs translate to a lower collective standard of living that could be corrected and improved upon if dropouts would graduate or even go back to earn their high school equivalency diploma GED.
Figure 4 shows US dropout rates by race for 1972 and 1980-2006. Overall, the dropout rate has been slightly declining for years, but remains disproportionately high for non-Whites. This confirms data listed above and shows that it has been an ongoing problem, especially where non-White schools and districts have been historically underfunded at the basic level of need.
Figure 4. Percentage of United States High School Dropouts by Race for 1972, 1980-2006*
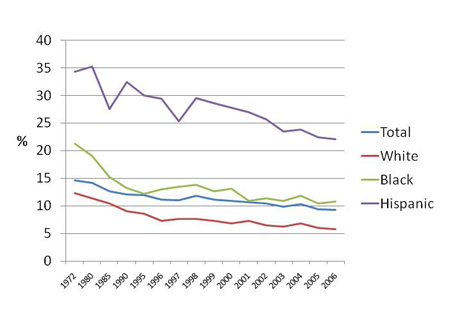
*U.S. Department of Education, National Center for Education Statistics. (2008). The Condition of Education 2008 (NCES 2008-031), Indicator 23.
There appears to be a geographic trend in best and worst dropout rates by states. Look at Table 4 below to see state dropout rates with the 10 best. Please note that all of the 10 best states with lowest dropout rates located in the Northern states, except one Western state, Utah.
Table 4. 2005 Ten Best States for Dropout Rates (lowest) From Amos 2008
| State | Percent Dropout |
| 1. New Jersey | 16.7 |
| 2. Iowa | 17.2 |
| 3. Wisconsin | 19.5 |
| 4. Pennsylvania | 19.6 |
| 5. Vermont | 19.8 |
| 6. Nebraska | 20.4 |
| 7. North Dakota | 20.8 |
| 8. Utah | 21.4 |
| 9. Connecticut | 21.9 |
| 10. Minnesota | 21.9 |
*Extracted from Jason Amos, (August 2008) Dropouts, Diplomas, and Dollars: US High Schools and the Nation’s Economy taken from Internet on 24 March 2009 from http://www.all4ed.org/files/Econ2008.pdfAll4edu funded by Bill and Malinda gates Foundation.
Now look at Table 5 to see the 10 worst states with highest dropout rates. Seven of the 10 are in the Southern states with Washington DC in the North and New Mexico and Nevada in the west.
Table 5. 2005 Ten Worst States for Dropout Rates (highest) From Amos 2008
| State | Percent Dropout |
| 1. Mississippi | 38.2 |
| 2. Alabama | 38.7 |
| 3. Florida | 39.2 |
| 4. Delaware | 39.9 |
| 5. Georgia | 41.9 |
| 6. District of Columbia | 42.4 |
| 7. South Carolina | 44.4 |
| 8. Louisiana | 45.3 |
| 9. New Mexico | 45.9 |
| 10. Nevada | 54.6 |
*Extracted from Jason Amos, (August 2008) Dropouts, Diplomas, and Dollars: US High Schools and the Nation’s Economy taken from Internet on 24 March 2009 from http://www.all4ed.org/files/Econ2008.pdfAll4edu funded by Bill and Malinda gates Foundation.
For those who stay in school, there becomes an issue of quality of education. I know it is relatively difficult to define what “quality of education” even means, much less which states or schools get the best quality. It’s a real challenge given that the US spent about $290,700,000,000 on public education in 2007 which is designed to serve nearly 50,000,000 public education students (taken 24 March 2009 from http://nces.ed.gov/ andhttp://nces.ed.gov/pubs2009/expenditures/tables/table_03.asp ).
We can approach quality of education at the personal level. One thing you can try to avoid at your own educational personal level is what is called Bureaucratic Ritualism, or the habit of following the rules and procedures and forgetting the main purpose of the bureaucracy's mission. So often teachers, schools, and school districts become large and they end up trying to meet the needs of 10's of thousands of diverse students and do so fairly.
This inevitably leads to what educational leaders call Transparency - the creation of rules, regulations, and guidelines to be followed by all students, teachers, and parents. Transparency is a bureaucratic effort to be open, fair, and legally protected. It also creates a culture of a bureaucracy rather than a culture of learning. Students come to feel like a number and not an individual. Students get bored, disheartened, and fall into the daily routines and become somewhat a part of the bureaucracy. This is bureaucratic ritualism and it can be fatal to learning and creativity.
Table 6 below shows the state by state per pupil total spending as reported in 2007. Please note that the worst per pupil spending is also the 8th best state for low dropout rates in 2005, Utah. There are also 2 states on Table 5 that were among the 10 worst for dropout rates.
Table 6. 2007 Top Worst States for Annual Per Pupil Spending*
| State | # of Students | $Per Pupil Expenditures |
| 1. Utah | 523,586 | 5,706 |
| 2. Idaho | 267,380 | 6,648 |
| 3. Tennessee | 978,368 | 7,129 |
| 4. Arizona | 1,065,082 | 7,338 |
| 5. Oklahoma | 639,391 | 7,430 |
| 6. Mississippi | 495,026 | 7,459 |
| 7. Nevada | 424,240 | 7,806 |
| 8. Texas | 4,599,509 | 7,850 |
| 9. North Carolina | 1,427,880 | 7,878 |
| 10. Kentucky | 683,173 | 7,940 |
| 11. South Dakota | 121, 158 | 8,064 |
*taken 24 March 2009 from ttp://nces.ed.gov/pubs2009/expenditures/tables/table_03.asp Table 3. Student membership and current expenditures per pupil for public elementary and secondary education, by function, subfunction, and state or jurisdiction: Fiscal year 2007
Compared to other countries the US does not always compete in math, reading, and problem solving. An analysis of 2003 comparative data between the US and a dozen other countries yielded some discouraging results, given the hundreds of billions spent for US public education each year. For mathematics, the US scored worse than 12 other countries with Korea, Canada, Hong Kong, Netherlands, and Japan coming in the top 5. In reading the US scored worse than 10 other countries with Korea, Canada, Hong Kong, Ireland, and Sweden coming in the top 5. In problem solving, the US Scored worse than 12 other countries with Korea, Hong Kong, Canada, Japan and Denmark coming in the top 5. The US did beat Italy and Mexico in math, reading, and problem solving and also beat Spain and Germany in reading (see Baum and Ma, 2007).
Date: 2015-02-28; view: 2243
| <== previous page | | | next page ==> |
| Our Standard of Living | | | The Economy In Society |