CATEGORIES:
BiologyChemistryConstructionCultureEcologyEconomyElectronicsFinanceGeographyHistoryInformaticsLawMathematicsMechanicsMedicineOtherPedagogyPhilosophyPhysicsPolicyPsychologySociologySportTourism
BACTERIAL GROWTH
Generation Time
Bacterial growth is synonymous with bacterial cell reproduction. Growing bacterial cells increase in biomass through their metabolism in which they convert compounds containing carbon, nitrogen, phosphorus, and other elements into the components of the cell. Most then divide into progeny of equal biomass through binary fission. By its very nature, bacterial reproduction by binary fission results in doubling of the
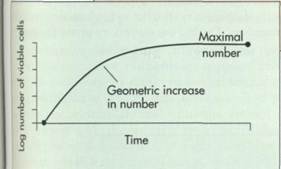
number of viable bacterial cells. Therefore, during a tive bacterial growth, the size of the microbial populi tion is continuously doubling. Once cell division h gins, it proceeds exponentially as long as growth coi ditions permit. One cell divides to form two, each ( these cells divides so that four cells form, and so fort in a geometric progression. The time required tachieve a doubling of the population size, known a the generation timeor doubling time,is the unit с measure of microbial growth rate (FIG. 10-3).
_____ METHODOLOGY
Logarithms
To conveniently represent large numbers, particularly when the numbers may range over many orders of magnitude (multiples of 10)—as is the case for numbers of bacterial cells that may occur as a few or millions of cells—scientists use a mathematical transformation called the logarithmic transformation. The logarithm to the base 10 (log10) of a number is the exponent indicating the power of 10 to which a number must be raised to produce a given number. Thus the log1010 = 1 because the exponent to which 10 must be raised to equal 10 is 1 (101). Similarly the log10100 = 2 because 102 = 100, and thus the exponent of 10 needed to equal 100 = 2. In a similar fashion the log10l,000 = 3, log1010,000 = 4, log10100,000 = 5, log10l,000,000 = 6, and so forth. Obviously in plotting the growth of a bacterial cell over the range of generations that takes 1 cell (log10l = 0) to 1 billion cells (log10l,000,000,000 = 9), it is far easier to
plot the logarithm of the cell number using a scale of 0 to 9 than it would be to try to plot the cell numbers on an arithmetic scale of 1 to 1,000,000,000 (see Figure).
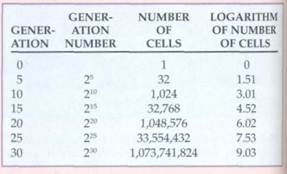
Comparison of arithmetic number of cells and logarithmic in- j crease in numbers during bacterial growth.
BACTERIAL GROWTH 289
|
|
|
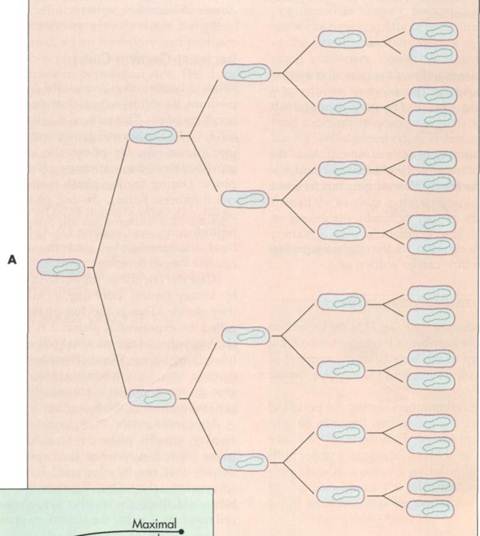
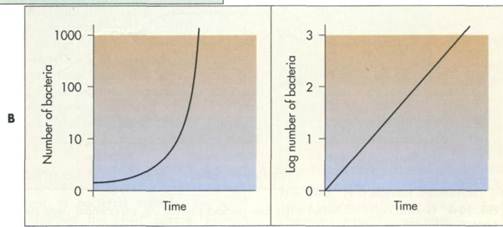
FIG. 10-3 A, During exponential growth the number of cells doubles each generation time. B, A graph of the log number of bacteria versus time (right) compared with number of bacteria versus time (left).
Date: 2015-02-28; view: 2776
| <== previous page | | | next page ==> |
| CHAPTER 10 BACTERIAL REPRODUCTION AND GROWTH OF MICROORGANISMS | | | CHAPTER 10 BACTERIAL REPRODUCTION AND GROWTH OF MICROORGANISMS |