CATEGORIES:
BiologyChemistryConstructionCultureEcologyEconomyElectronicsFinanceGeographyHistoryInformaticsLawMathematicsMechanicsMedicineOtherPedagogyPhilosophyPhysicsPolicyPsychologySociologySportTourism
F Languages
 The USA doesn’t have official language (although legal documents are normally written in English)! American English is just the commonly spoken language with only 28 states recognizing it officially. Hawaii is the only US state to have two official languages - English and Hawaiian. According to the latest census (2010) English is used only by 80% of the population. The second widely spoken language is Spanish, spoken by 12,3 % of the population. It’s native to the immigrants from Latin America. Asian languages are used by 2,3%. Native American languages are the main language of 0.9% of residents. There is a wide variety of different Native American languages, many of which are on the endangered list. The most widely spoken is Southern Quechua, used by around 7 million people.
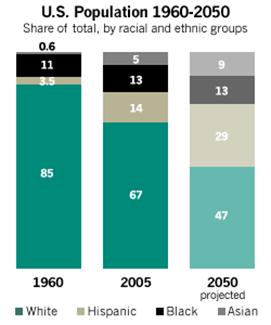
G Population Growth Projections
The population of the US continues to grow, even today. The latest data from the Census Bureau shows that US population growth is running at 0.9% per year. They estimate that growth will continue fairly steadily over the next four decades, and that the US will reach a population of 400 million in 2039. If their predictions are correct, the US population in 2050 will be around 439 million.
The future US population will be different to the population today, though.
The country’s racial profile will be vastly different and, although whites will remain the single largest racial group in the US, they will no longer be a majority. Growth in the Hispanic and Asian populations is predicted to almost triple over the next 40 years. The chart alongside this paragraph illustrates those changes.
The average US citizen of 2050 is likely to be older than the average citizen of today, and almost one in five people will be 65 or older. At the same time, the percentage of people who are working age (18-64) is likely to fall from 63% today to 57% in 2050. This will have huge implications for society as younger people work to fund the pensions and healthcare of the older.
H Working & Unemployment Rates
As of November 2013, the U.S. unemployment rate was 7.0 %.
Income Inequality
Income inequality in the United States has grown significantly since the early 1970s, after several decades of stability, and has been the subject of study of many scholars and institutions. While inequality has risen among most developed countries, and especially English-speaking ones, it is highest in the United States. Income inequality is not uniform among the states: after-tax income inequality in 2009 was greatest in Texas and lowest in Maine.
During the Great Recession of 2007–2009, inequality declined, with total income going to the bottom 99 percent of Americans declining by 11.6%, but falling faster (36.3%) for the top 1%.
However, disparity in income increased again during the 2009–2010 recovery, with the top 1% of income earners capturing 11.6% of income and capital gains, and the income of the other 99% remained flat, growing by only 0.2%. 60% of earners in the top 0.1 percent are executives, managers, supervisors, and financial professionals. More than half of them work in closely held businesses. The top 1 percent is composed of many professions, the five most common professions being managers, physicians, administrators, lawyers, and financial specialists. Doctors are more likely than any other profession to be in the 1 percent.
Average Income
| Persons, age 25 or older with earnings | Household income by race | |||||
| Males | Females | Both sexes | Asian | White | Hispanic | Black |
| $39,403 | $26,507 | $32,140 | $57,518 | $48,977 | $34,241 | $30,134 |
Income levels vary by gender and race with median income levels considerably below the national median for females compared to men with certain racial demographics.
Despite considerable progress in pursuing gender and racial equality, some social scientists attribute these discrepancies in income partly to continued discrimination.
Among women, part of the wage gap is due to employment choices and preferences. Women are more likely to consider factors other than salary when looking for employment. On average, women are less willing to travel or relocate, take more hours off and work fewer hours, and choose college majors that lead to lower paying jobs. Women are also more likely to work for governments or non-profits that pay less than the private sector. According to this perspective certain ethnic minorities and women receive fewer promotions and opportunities for occupation and economic advancement than others. In the case of women this concept is referred to as the glass ceiling keeping women from climbing the occupational ladder.
NB! A glass ceiling is a political term used to describe "the unseen, yet unbreakable barrier that keeps minorities and women from rising to the upper rungs of the corporate ladder, regardless of their qualifications or achievements."
In terms of race, Asian Americans are far more likely to be in the highest earning 5 percent than the rest of Americans. Studies have shown that African Americans are less likely to be hired than White Americans with the same qualifications. The continued prevalence of traditional gender roles and ethnic stereotypes may partially account for current levels of discrimination. In 2005, median income levels were highest among Asian and White males and lowest among females of all races, especially those identifying as African American or Hispanic. Despite closing gender and racial gaps, considerable discrepancies remain among racial and gender demographics, even at the same level of educational attainment. The economic success of Asian Americans may come from how they devote much more time to education than their peers. Asian Americans have significantly higher college graduation rates than their peers and are much more likely to enter high status and high income occupations.
Racial differences remained stark as well, with the highest earning sex-gender demographic of workers aged 25 or older, Asian males (who were roughly tied with white males) earning slightly more than twice as much as the lowest-earning demographic, Hispanic females. As mentioned above, inequality between races and gender persisted at similar education levels. Racial differences were overall more pronounced among male than among female income earners. In 2009, Hispanics were more than twice as likely to be poor than non-Hispanic whites, research indicates. Lower average English ability, low levels of educational attainment, part-time employment, the youthfulness of Hispanic household heads, and the 2007–09 recession are important factors that have pushed up the Hispanic poverty rate relative to non-Hispanic whites.
Average income by education
| Measure | Some High School | High school graduate | Some college | Associate's degree | Bachelor's degree or higher | Bachelor's degree | Master's degree | Professional degree | Doctorate degree |
| Male, age 25+ w/ earnings | $24,192 | $32,085 | $39,150 | $42,382 | $60,493 | $52,265 | $67,123 | $100,000 | $78,324 |
| Female, age 25+ w/ earnings | $15,073 | $21,117 | $25,185 | $29,510 | $40,483 | $36,532 | $45,730 | $66,055 | $54,666 |
| Persons, age 25+, employed full-time | $25,039 | $31,539 | $37,135 | $40,588 | $56,078 | $50,944 | $61,273 | $100,000 | $79,401 |
Social classes
Social class in the United States is a controversial issue, having many competing definitions, models, and even disagreements over its very existence. Many Americans believe in a simple three-class model that includes the "rich", the "middle class", and the "poor". More complex models that have been proposed describe as many as a dozen class levels; while still others deny the very existence, in the European sense, of "social class" in American society. Most definitions of class structure group people according to wealth, income, education, type of occupation, and membership in a specific subculture or social network.
Sociologists Dennis Gilbert, William Thompson, Joseph Hickey, and James Henslin have proposed class systems with six distinct social classes. These class models feature an upper or capitalist class consisting of the rich and powerful, an upper middle class consisting of highly educated and affluent professionals, a middle class consisting of college-educated individuals employed in white-collar industries, a lower middle class composed of semi-professionals with typically some college education, a working class constituted by clerical and blue collar workers whose work is highly routinized, and a lower class divided between the working poor and the unemployed underclass.
Academic Class Model by William Thompson & Joseph Hickey, 2005
| Class | Typical characteristics |
| Upper class (1%) | Top-level executives, celebrities, heirs; income of $500,000+ common. Ivy league education common. |
| Upper middle class (15%) | Highly-educated (often with graduate degrees) professionals & managers with household incomes varying from the high 5-figure range to commonly above $100,000. |
| Lower middle class (32%) | Semi-professionals and craftsmen with some work autonomy; household incomes commonly range from $35,000 to $75,000. Typically, some college education. |
| Working class (32%) | Clerical, pink- and blue-collar workers with often low job security; common household incomes range from $16,000 to $30,000. High school education. |
| Lower class (ca. 14% - 20%) | Those who occupy poorly-paid positions or rely on government transfers. Some high school education. |
Sources
Date: 2015-02-16; view: 1541
| <== previous page | | | next page ==> |
| C Density of Population | | | quot;Understand it sufficiently well to extinguish it?" asked Professor van Linden of Alchemy. x |