CATEGORIES:
BiologyChemistryConstructionCultureEcologyEconomyElectronicsFinanceGeographyHistoryInformaticsLawMathematicsMechanicsMedicineOtherPedagogyPhilosophyPhysicsPolicyPsychologySociologySportTourism
Basic Trading Strategies and Techniques
divergences, or other signals that I use with various indicators is ac- cepted at all. My own interpretation of these signals is different from the classical and standard, so each of them requires a separate and detailed explanation.
Ascending or descending trendlines practically always give a perfect op- portunity to construct a trade plan based on them. The clearer, more dis- tinct, and more obvious a trendline is, the easier the trade should be. I recommend that you pay attention to the phenomenon I have discovered, which for some reason has been overlooked in numerous technical analy- sis handbooks and recommendations: Any trendline correctly drawn through three or more points will be broken sooner or later. If such a line hasn’t been broken yet, it becomes a zone of attraction for the market to return to it. There is an obvious and rather simple explanation to this fact. Signifi- cant stops accumulate gradually behind such a line and the market then begins to successfully pursue on them.
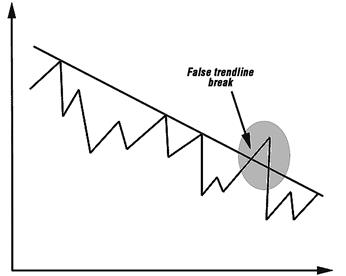
The probability of a false break is higher if such a line has had only a few contact points for a long period of time, and the market hasn’t done significant retracement along the trend yet. See Figure 9.1 In other words, a sharp and impulsively high amplitude movement fol- lowed by the break of a trend line, should serve as a warning that the break may be a false one. By contrast, the long period of market consoli- dation directly before the break more often specifies the high probability that significant follow-through or trend change will follow the break. In any case, even if you don’t know whether the trend line will be broken now or later, or whether this break will be real or false, the next approach to the trend line gives an opportunity to open a new position. At first you trade away from the trend line. As the market emerges from underneath the line, open a sell position. If the market emerges from the top, it gives you a signal to open a buy position. Stops, as always, are obligatory and they should be established directly behind the line, at a distance not exceeding 10 to 15 pips from it. Simultaneously, with the stops liquidating your initial position, you may place so-called entry stops for opening a new position in an opposite direction. For example, the line is used as a support or resistance (depending on the specific sit-
FIGURE 9.1 A false break of the trendline is usually a confirmation of the ongo- ing trend continuation.
uation) and as a border. When the market crosses this border, it auto- matically gives a signal to change direction of a trader’s position. See Figure 9.2. There are three possible subsequent scenarios:
The First Scenario (No Break of a Trendline Occurred)
If the trendline does not break, then according to the first two basic pos- tulates of the philosophical conception, your initial position will be to open away from the trendline, which will bring some profit in a short pe- riod of time. After placing stops, you can relax and enjoy watching a profit growing and accumulating on your position. Take profit later ac- cording to the trade plan made in advance within the time frame you se- lected. See Figure 9.3.
FIGURE 9.2 A trendline is like a borderline between the market territory and open space. Right ahead of an ascending trendline, you should take a short posi- tion. Be cautious, because every line drawn through any three significant points will be broken sooner or later. Each subsequent market approach to such a line in- creases the probability of a break. If a break takes place, stop and reverse your po- sition a short distance from the break point.
FIGURE 9.3 This scenario is the most desirable for a trader. A trendline held once again, and a short position open ahead of the line should be liquidated and profit realized in accordance with the initial trading plan.
Date: 2015-12-17; view: 889
|