CATEGORIES:
BiologyChemistryConstructionCultureEcologyEconomyElectronicsFinanceGeographyHistoryInformaticsLawMathematicsMechanicsMedicineOtherPedagogyPhilosophyPhysicsPolicyPsychologySociologySportTourism
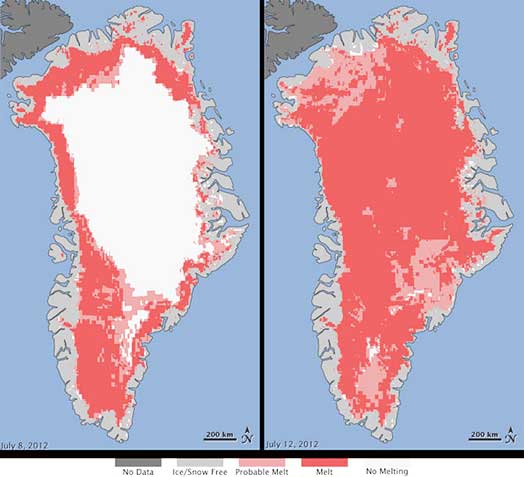
Previously posted on IzilwaneExtent of surface melt over Greenland’s ice sheet on July 8 (left) and July 12 (right). Measurements from three satellites showed that on July 8, about 40 percent of the ice sheet had undergone thawing at or near the surface. In just a few days, the melting had dramatically accelerated and an estimated 97 percent of the ice sheet surface had thawed by July 12. In the image, the areas classified as “probable melt” (light pink) correspond to those sites where at least one satellite detected surface melting. The areas classified as “melt” (dark pink) correspond to sites where two or three satellites detected surface melting. The satellites are measuring different physical properties at different scales and are passing over Greenland at different times. As a whole, they provide a picture of an extreme melt event about which scientists are very confident. Credit: Nicolo E. DiGirolamo, SSAI/NASA GSFC, and Jesse Allen, NASA Earth
For several days this month, Greenland’s surface ice cover melted over a larger area than at any time in more than 30 years of satellite observations. Nearly the entire ice cover of Greenland, from its thin, low-lying coastal edges to its two-mile-thick center, experienced some degree of melting at its surface, according to measurements from three independent satellites analyzed by NASA and university scientists. On average in the summer, about half of the surface of Greenland’s ice sheet naturally melts. At high elevations, most of that melt water quickly refreezes in place. Near the coast, some of the melt water is retained by the ice sheet and the rest is lost to the ocean. But this year the extent of ice melting at or near the surface jumped dramatically. According to satellite data, an estimated 97 percent of the ice sheet surface thawed at some point in mid-July. Researchers have not yet determined whether this extensive melt event will affect the overall volume of ice loss this summer and contribute to sea level rise. “The Greenland ice sheet is a vast area with a varied history of change. This event, combined with other natural but uncommon phenomena, such as the large calving event last week on Petermann Glacier, are part of a complex story,” said Tom Wagner, NASA’s cryosphere program manager in Washington. “Satellite observations are helping us understand how events like these may relate to one another as well as to the broader climate system.” Son Nghiem of NASA’s Jet Propulsion Laboratory in Pasadena, Calif., was analyzing radar data from the Indian Space Research Organisation’s (ISRO) Oceansat-2 satellite last week when he noticed that most of Greenland appeared to have undergone surface melting on July 12. Nghiem said, “This was so extraordinary that at first I questioned the result: was this real or was it due to a data error?” Nghiem consulted with Dorothy Hall at NASA’s Goddard Space Flight Center in Greenbelt, Md. Hall studies the surface temperature of Greenland using the Moderate-resolution Imaging Spectroradiometer (MODIS) on NASA’s Terra and Aqua satellites. She confirmed that MODIS showed unusually high temperatures and that melt was extensive over the ice sheet surface. Thomas Mote, a climatologist at the University of Georgia, Athens, Ga; and Marco Tedesco of City University of New York also confirmed the melt seen by Oceansat-2 and MODIS with passive-microwave satellite data from the Special Sensor Microwave Imager/Sounder on a U.S. Air Force meteorological satellite. The melting spread quickly. Melt maps derived from the three satellites showed that on July 8, about 40 percent of the ice sheet’s surface had melted. By July 12, 97 percent had melted. This extreme melt event coincided with an unusually strong ridge of warm air, or a heat dome, over Greenland. The ridge was one of a series that has dominated Greenland’s weather since the end of May. “Each successive ridge has been stronger than the previous one,” said Mote. This latest heat dome started to move over Greenland on July 8, and then parked itself over the ice sheet about three days later. By July 16, it had begun to dissipate. Even the area around Summit Station in central Greenland, which at 2 miles above sea level is near the highest point of the ice sheet, showed signs of melting. Such pronounced melting at Summit and across the ice sheet has not occurred since 1889, according to ice cores analyzed by Kaitlin Keegan at Dartmouth College in Hanover, N.H. A National Oceanic and Atmospheric Administration weather station at Summit confirmed air temperatures hovered above or within a degree of freezing for several hours July 11-12. “Ice cores from Summit show that melting events of this type occur about once every 150 years on average. With the last one happening in 1889, this event is right on time,” says Lora Koenig, a Goddard glaciologist and a member of the research team analyzing the satellite data. “But if we continue to observe melting events like this in upcoming years, it will be worrisome.” Nghiem’s finding while analyzing Oceansat-2 data was the kind of benefit that NASA and ISRO had hoped to stimulate when they signed an agreement in March 2012 to cooperate on Oceansat-2 by sharing data. Floating Cities – Video By Guest, February 14, 2012 With the effects from climate change, The Netherlands are facing a new challenge. The current predictions are that the sea level around The Netherlands could rise from between 65 cm (25 in) and 130 cm (51 in) by the end of the century. The municipality, West Maas En Whaal, has become a testbed for new ideas to meet the challenges of sea level rise and flooding. The floating cities concept is an intriguing one, in a country so susceptible to rising sea levels. Karina Czapiewska, an engineer at DeltaSync said, “Our vision is that in the future we will live in a more sustainable world. And lots of parts of Holland will live on water.” The Environmental Atlas of Europe is a UNEP-EEA-ESA joint project showcasing communities responding to environmental change across Europe. The films present a series of these inspirational stories about how people are responding to climate change and in so doing, transforming their lives for a more sustainable future. Produced by Ace & Ace, Denmark, in cooperation with the European Environment Agency (EEA), United Nations Environment Programme UNEP and the European Space Agency (ESA).
TEXT 10. Iraqi Green Belt Fights Desertification By Guest, June 14, 2012 Sandstorms Now Pose More of a Problem Than Explosions Trees as far as the eye can see are the weapons one Iraqi province is using in the fight against desertification. Karbala is the location of a six-year-old project aimed at fighting worsening desertification in Iraq. The green belt, a 27 km (17 mile) crescent lined with thousands of young trees in orderly patterns, irrigated by dozens of wells. There are plans to widen the green belt “ten-fold” in the near future. The project has involved the planting of 62,000 olive trees, 20,500 palm trees, 37,000 eucalyptus trees and 4,200 tamarind trees, all of which were chosen for their root strength as well as for the food some will produce. Previously, the area was used as a military encampment but is now the front line of Karbala’s battle against increasingly frequent sandstorms and salinization of the land.
TEXT 11. The Global Impact of Climate Change By Guest, January 12, 2012 By Altaire Cambata Previously posted on Izilwane Image used with permission of Altaire Cambata and Practical Action Who Wins, Who Loses, and Can Traditional Ecological Knowledge Settle the Score? What are the implications for indigenous or place-based cultures facing the imminent and gradually destructive processes of climate change? There is a significant amount of literature that suggests the most vulnerable, natural resource-dependent groups of the world will disproportionately experience the harmful effects of climate change. Less developed countries and their indigenous populations are largely agricultural, dependent on the land for subsistence and economic livelihoods. Because agriculture is the most sensitive of all economic sectors, countries and regions most dependent on the environment will not only witness increased illness and escalating death rates due to the heat, but also persistent poverty and deteriorating infrastructure. The cumulative effects of climate change on water supplies and farming systems, and the habitability of such areas, will provoke drastic economic and cultural impacts by broadening the divide between those who can afford to adapt and those who do not have the money, knowledge or time to do so. Conversely, victims of climate change are potential agents of solutions, leadership, climatic wisdom and untapped contributions to Western science. Through the increasingly popular anthropological method of collecting traditional ecological knowledge (TEK) in climatically vulnerable areas, scientists and anthropologists have slowly recognized indigenous groups as possessors of information critical to the study of climate change. The value of their knowledge and potential contributions to the reduction of global inequalities will be explored below. Although the debate of whether or not climate change is a human-generated phenomenon still rages on and many politicians prolong any governmental policy concerning contested predictions about a planet warming beyond recovery, climate scientists overwhelmingly agree that the average global temperature continues to increase as a result of anthropogenic (human-caused) greenhouse gas emissions and deforestation. The combination of gases such as carbon dioxide, methane, nitrous and sulphur oxides, and chlorofluorocarbons in the atmosphere has contributed to the planet’s ability to trap heat and thus alter climatic behavior. Based on current trends of climate change, average global temperatures should rise by three degrees Fahrenheit (two degrees Celsius) over the next fifty to seventy years, a shift that could prove devastating. Like air pollution, climate change is transboundary. Despite a nation’s involvement or lack thereof in catalyzing global warming, the subsequent ecological problems will affect all people and all nations. Species extinction and sea level rise are encumbrances borne by the entire globe, but more so in the developing world, where the contributions to atmosphere pollution have been the smallest, even negligent (excluding “more developed” economies such as those of India, China and Brazil). By contrast, the United States, which emits 20 percent of the world’s greenhouse gases, is more financially equipped to protect its citizens (five percent of the global population) from the consequences of climate change. This is largely due to its rapid carbon-heavy industrialization in the 1800s, which ensured its economic security.
TEXT 12. Soundscape Ecology: Studying Nature’s Rhythms By Guest, August 24, 2012 By Cheryl Dybas, National Science Foundation Geophony. Biophony. Anthrophony. Unfamiliar words. But they shouldn’t be. We’re surrounded by them morning, noon and night, say ecologist Bryan Pijanowski of Purdue University and colleagues. The evening “singing” of frogs. Burbling brooks, breaking waves and the whistling wind. Planes, trains and automobiles.
What they add up to is a cacophony–a mix of sounds made by the environment, and by people; a background to which most have become tone-deaf. “Another word for it is ‘soundscape,’” says Pijanowski.
“Natural sound could be the ‘canary in the coal mine,’” says Pijanowski. “Sound might be the critical first indicator of changes in climate and weather patterns, or the presence of pollution.”
Since Rachel Carson’s far-reaching 1962 book Silent Spring, the sounds of nature have been linked with environmental quality. “Over increasingly large areas of the United States,” wrote Carson in Silent Spring, “spring now comes unheralded by the return of the birds. The early mornings are strangely silent where once they were filled with the beauty of bird song.” Carson’s observations turned out to be right. What began as her observation of sound–or its absence–ultimately led to the ban of DDT, the insecticide responsible for precipitous drops in numbers of bald eagles and their avian relatives. The study of soundscapes can yield valuable information about very different landscapes, say Pijanowski and colleagues like Bernie Krause of Wild Sanctuary, Inc., in Glen Ellen, California, and Almo Farina of Urbino University in Italy. Pijanowski has mapped soundscapes in wetlands and agricultural fields in Tippecanoe County, Indiana; near burbling streams and in high-wind chaparral in Sequoia National Park, California; and in the bird-song-filled forests of Italy and Costa Rica. The ecosystem that surrounds the La Selva Biological Station in Costa Rica, for example, is home to more than 5,000 species of plants, 500 species of birds, three dozen frogs and kin and hundreds of species of insects. All these animals–including poison dart frogs, cicadas, great green macaws and howler monkeys–contribute to the La Selva biophony. “Geophony is a hallmark of this landscape, too, with strong winds moving through trees, raging rivers audible from far away, and intense tropical rain showers that fill the ‘acoustic spaces,’” says Pijanowski.
The daily maps show that large seasonal changes happen in this beech forest. “We anticipated that the maps would be similar,” says Pijanowski. “But that wasn’t the case.” Soundscapes, he believes, represent the heritage of our planet’s acoustic biodiversity and reflect Earth’s assemblages of organisms. “Natural sounds are an auditory link with our environment, one we need. Society’s growing ‘nature deficit disorder’ is likely to increase as we replace these sounds with the din made by humans.” Almost 50 years ago, Rachel Carson highlighted the dangers of pesticides and their potential threats to wildlife, and to us. A half-century later, “the unintended silencing of organisms by human activities is an indication of our continued effect on the planet’s ecosystems,” says Pijanowski. Through soundscape ecology, he hopes to record and study Earth-music–while there’s still time. While frogs yet sing, waves break, and the wind whistles through the forest.
Pijanowski and colleagues have received a grant from the National Science Foundation‘s (NSF) Dynamics of Coupled Natural and Human Systems (CNH) Program to study soundscapes. NSF CNH awardees work to provide a better understanding of natural processes and cycles, and of human behavior and decisions–as well as understanding how and where they intersect. NSF’s Directorates for Biological Sciences (BIO), Geosciences (GEO) and Social, Behavioral & Economic Sciences (SBE) support the CNH program. CNH is part of NSF’s Science, Engineering and Education for Sustainability (SEES) initiative. “CNH highlights the need for scientists from different fields to work together and benefit from each other’s perspectives to gain an understanding of the complex ways people interact with Earth’s natural systems,” says Tom Baerwald, CNH program director in SBE. “Findings from these projects will help individuals and groups address environmental problems more effectively.” “By bringing together researchers from a wide variety of academic fields,” adds Sarah Ruth, CNH program director in GEO, “the projects are providing valuable new insights into the ways in which we, our environment, and the natural resources we rely on act as one interconnected system.” “CNH addresses societal challenges in the management of ‘ecosystem services’ and in adaptation to climate change,” says Alan Tessier, CNH program director in BIO. “The soundscapes project is one such effort.”
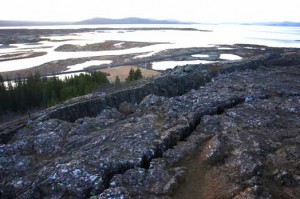
TEXT 13. Onset of Plate Tectonics Revealed By Guest, June 12, 2012 As far as we know, Earth is the only planet in the Solar System with active plate tectonics, but this is the first study to show when they began. The movement of plate tectonics can cause mountain ranges, earthquakes and tsunamis. Image Courtesy gamene Flickr Attribution 2.0 Generic (CC BY 2.0) We’re familiar with the theory that the Earth’s crust is composed of tectonic plates that move, sometimes dramatically to create earthquakes and tsunamis – but until recently, nobody knew how long this movement has been going on. An international team of researchers, including Dr Anthony Kemp from The University of Western Australia, believes they have found out and their work is published in Nature. Dr Kemp, an Australian Research Council Future Fellow in UWA’s School of Earth and Environment, said as far as we know, Earth is the only planet in the Solar System with active plate tectonics. “The purpose of this study was to examine the earliest rock record to find out when plate tectonics started and when the continental crust began to form,” he said. “We analysed zircon crystals from ancient rocks of Greenland. These rocks included some of the oldest and best-preserved parts of the Earth’s crust and were between 2.85 and 3.9 billion years old. “In much the same way that tree rings record the growth of a tree, zircons provide important insights into the nature and composition of the magma (molten material deep within the Earth’s crust) from which the zircon crystallised.” The researchers analysed the isotopes of oxygen and hafnium in the zircon to learn more about the crystals’ growth bands and discovered that the Greenland crust had evolved in two stages. The first involved a simple re-melting of 3.9 billion year-old rocks, followed by a second more complex period after about 3.2 billion years ago involving more diverse magma sources associated with re-melting and the formation of new continental material. “We attribute this transition to the onset of plate tectonics at approximately 3.2 billion years ago and infer that significant volumes of crust began to be stabilised as continents only after that time,” Dr Kemp said. “We’re now trying to verify and extend these findings by studying rocks from the Pilbara, which span the same key time period from 2.8 to 3.6 billion years ago. A broader aim is to identify the triggers for plate tectonics. “High-precision isotope measurements will be done at the Advanced Geochemistry and Mass Spectrometry Facility recently established at UWA by Winthrop Professor Malcolm McCulloch.” The project was led by Dr Tomas Naeraa from the Geological Survey of Denmark and Greenland, and also involved researchers from Sweden and Germany. Originally published by ScienceAlert and University of Western Australia
By Guest, August 14, 2012 By Brie Mazurek
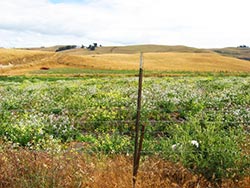
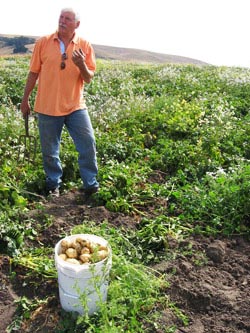
TEXT 14. Little Organic Farm, Marin, CA This week, as the nation grapples with the worst drought in decades, the USDA added more than 218 counties to its list of natural disaster areas, bringing the total to 1,584 — more than half of all U.S. counties. Farmers in the Midwest and Great Plains have been the hardest hit, but the drought is a growing reality for farmers across the country, including California. While the secretary of agriculture won’t comment on the drought’s link to climate change, it’s at the forefront of everyone’s mind, and as global warming unfolds, knowledge of dryland agriculture will become increasingly valuable. Farmer, David Little, in his organic potato field David Little of Little Organic Farm has had to adapt to water scarcity in California’s Marin and Sonoma counties, where most farmers and ranchers rely on their own reservoirs, wells, and springs, making them particularly vulnerable in years with light rainfall. Through a technique known as dry farming, farming without water, Little’s potatoes and squash receive no irrigation, getting all of their water from the soil. Mediterranean grape and olive growers have dry-farmed for thousands of years. The practice was common on the California coast from the 1800s through the early 20th century, but became a lost art during the mid-century. Today, dry farming is experiencing a modest resurgence along the coast, where temperate, foggy summers offer ideal conditions for dry farming grapes, tomatoes, potatoes, cucumbers, melons, grains, and some tree fruit. “In the beginning, I searched out people who were known dry-farmers,” says Little, who started farming in 1995. “It seemed like no one had done it for 30 years or so.” To find mentors, Little made the rounds at local bars, asking older farmers about their experiences. “They were very humble,” he says. “They told stories about how things were done, and I would pick up tidbits.” After years of trial and error, he now considers himself an expert. To help people understand how dry farming works, Little often evokes the image of a wet sponge covered with cellophane. Following winter and spring rains, the farmer will cultivated and break up the soil to create a moist “sponge.” Then the top layer is compacted using a roller to form a dry crust (the “cellophane”). This three- to four-inch layer, sometimes referred to as a dust mulch, seals in water and prevents evaporation. “It’s very challenging because you have to hold the moisture for long periods of time, and you don’t know how different crops are going to react in different areas,” Little says. Much of the land he farms is rolling hills and valleys, which present additional challenges because they hold and move groundwater differently than flat land. Deprived of any surface irrigation, dry-farmed plants develop deep, robust roots to seek out and soak up soil moisture. Because they absorb less water than their conventionally irrigated counterparts, dry-farmed crops are characteristically smaller but more nutrient-dense and flavorful.
TEXT 15. Devoto Garden's Gravenstein apples “When you water a tree, it dilutes the flavor a lot in some cases,” says Stan Devoto, who dry-farms more than 50 varieties of heirloom apples at Devoto Gardens. “Instead of having a really hard, crisp, firm texture, your apple will be two or three times the size of a dry-farmed apple, and you just don’t get the flavor.” Devoto has been dry-farming in Sebastopol, Calif., since the 1970s. “We had no choice,” he says. “There’s just not enough water. Pretty much all the orchards are dry-farmed, with the exception of the orchards where trees are planted super close or use dwarf rootstock.” Having wide orchard rows, which allow tree roots to spread out, is essential for dry-farming apples, as is thinning (removing much of the fruit early in its development) to ensure that each apple gets as much water as possible. In drier years (like this one), Devoto must work extra hard to control weeds, which drink water needed by thirsty trees. As the summer progresses, the ground slowly dries out, stressing out the fruits as they ripen, which helps the sugars become more concentrated. But while water conservation and intensely flavorful crops are the clear benefits of dry farming, the major tradeoff is yield. Devoto says that apple growers in West Sonoma County, which was once home to a booming apple industry, only get about 12 tons per acre, compared to 30 to 40 tons produced by large apple farms in the state’s Central Valley. Similarly, Joe Schirmer of Dirty Girl Produce says that his famous dry-farmed Early Girl tomatoes sometimes yield only about a third of what their irrigated counterparts produce. Meanwhile, Little estimates that he gets about a quarter to a third the yield of large organic potato growers. “It it’s hard to compete with some of these big organic farms that are watering,” he says. Without irrigation, his crops are at the mercy of seasonal rainfall and varying soil conditions from year to year. “You’re on the edge constantly, and one little thing could tip you over,” Little reflects. “We’re barely making it, really, but I believe in coastal farming. I believe we’re going to come back to it.” While dry farming has geographic limitations, it could pave the way for more coastal agriculture and offer techniques for farmers in drier areas to farm with less water. “The coast of California used to be our main source of food in the state, until they started developing farms in the Central Valley because of all the water,” Little continues. “Now they’re running out of water.” Devoto’s Gravenstein apples are coming into season as we speak. They may not be picture-perfect or super large, Devoto adds, “But the flavor is just phenomenal.”
Date: 2016-01-03; view: 1713
|

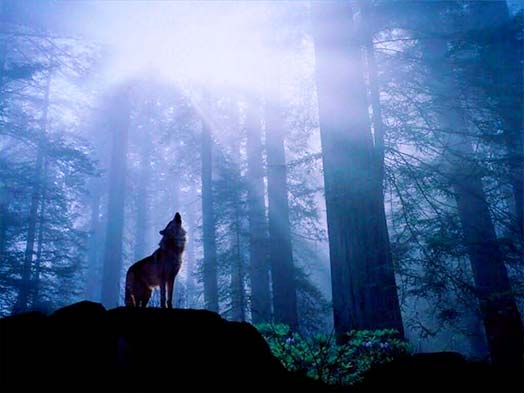
 Biophony is the music created by organisms like frogs and birds.
 Geophony is the composition of non-biological sounds like wind, rain and thunder.
 Anthrophony is the conglomeration of noise from humans.
 He and colleagues are leading an effort to spawn a new field called soundscape ecology. It uses “nature’s music” to understand the ecological characteristics of a landscape. It also reconnects people with Earth-sounds.
 The dawn and dusk choruses of birds, for example, are characteristic of a certain location. If the intensity or frequency of these melodies change, “there’s likely something causing it,” says Pijanowski. “Ecologists have largely ignored the ways in which sound can help determine what’s happening to an ecosystem.”
 Acoustic spaces are equally “noisy” in the beech forests of Italy’s Apennine National Park. There Pijanowski and other scientists collected three-hour recordings from 6 a.m. to 9 a.m. each day. Data from the acoustic recorders were used to construct “soundtopes”–three-dimensional maps of acoustics plotted across the landscape.