CATEGORIES:
BiologyChemistryConstructionCultureEcologyEconomyElectronicsFinanceGeographyHistoryInformaticsLawMathematicsMechanicsMedicineOtherPedagogyPhilosophyPhysicsPolicyPsychologySociologySportTourism
How to represent their orientation in space, using a 2D sheet of paper ?
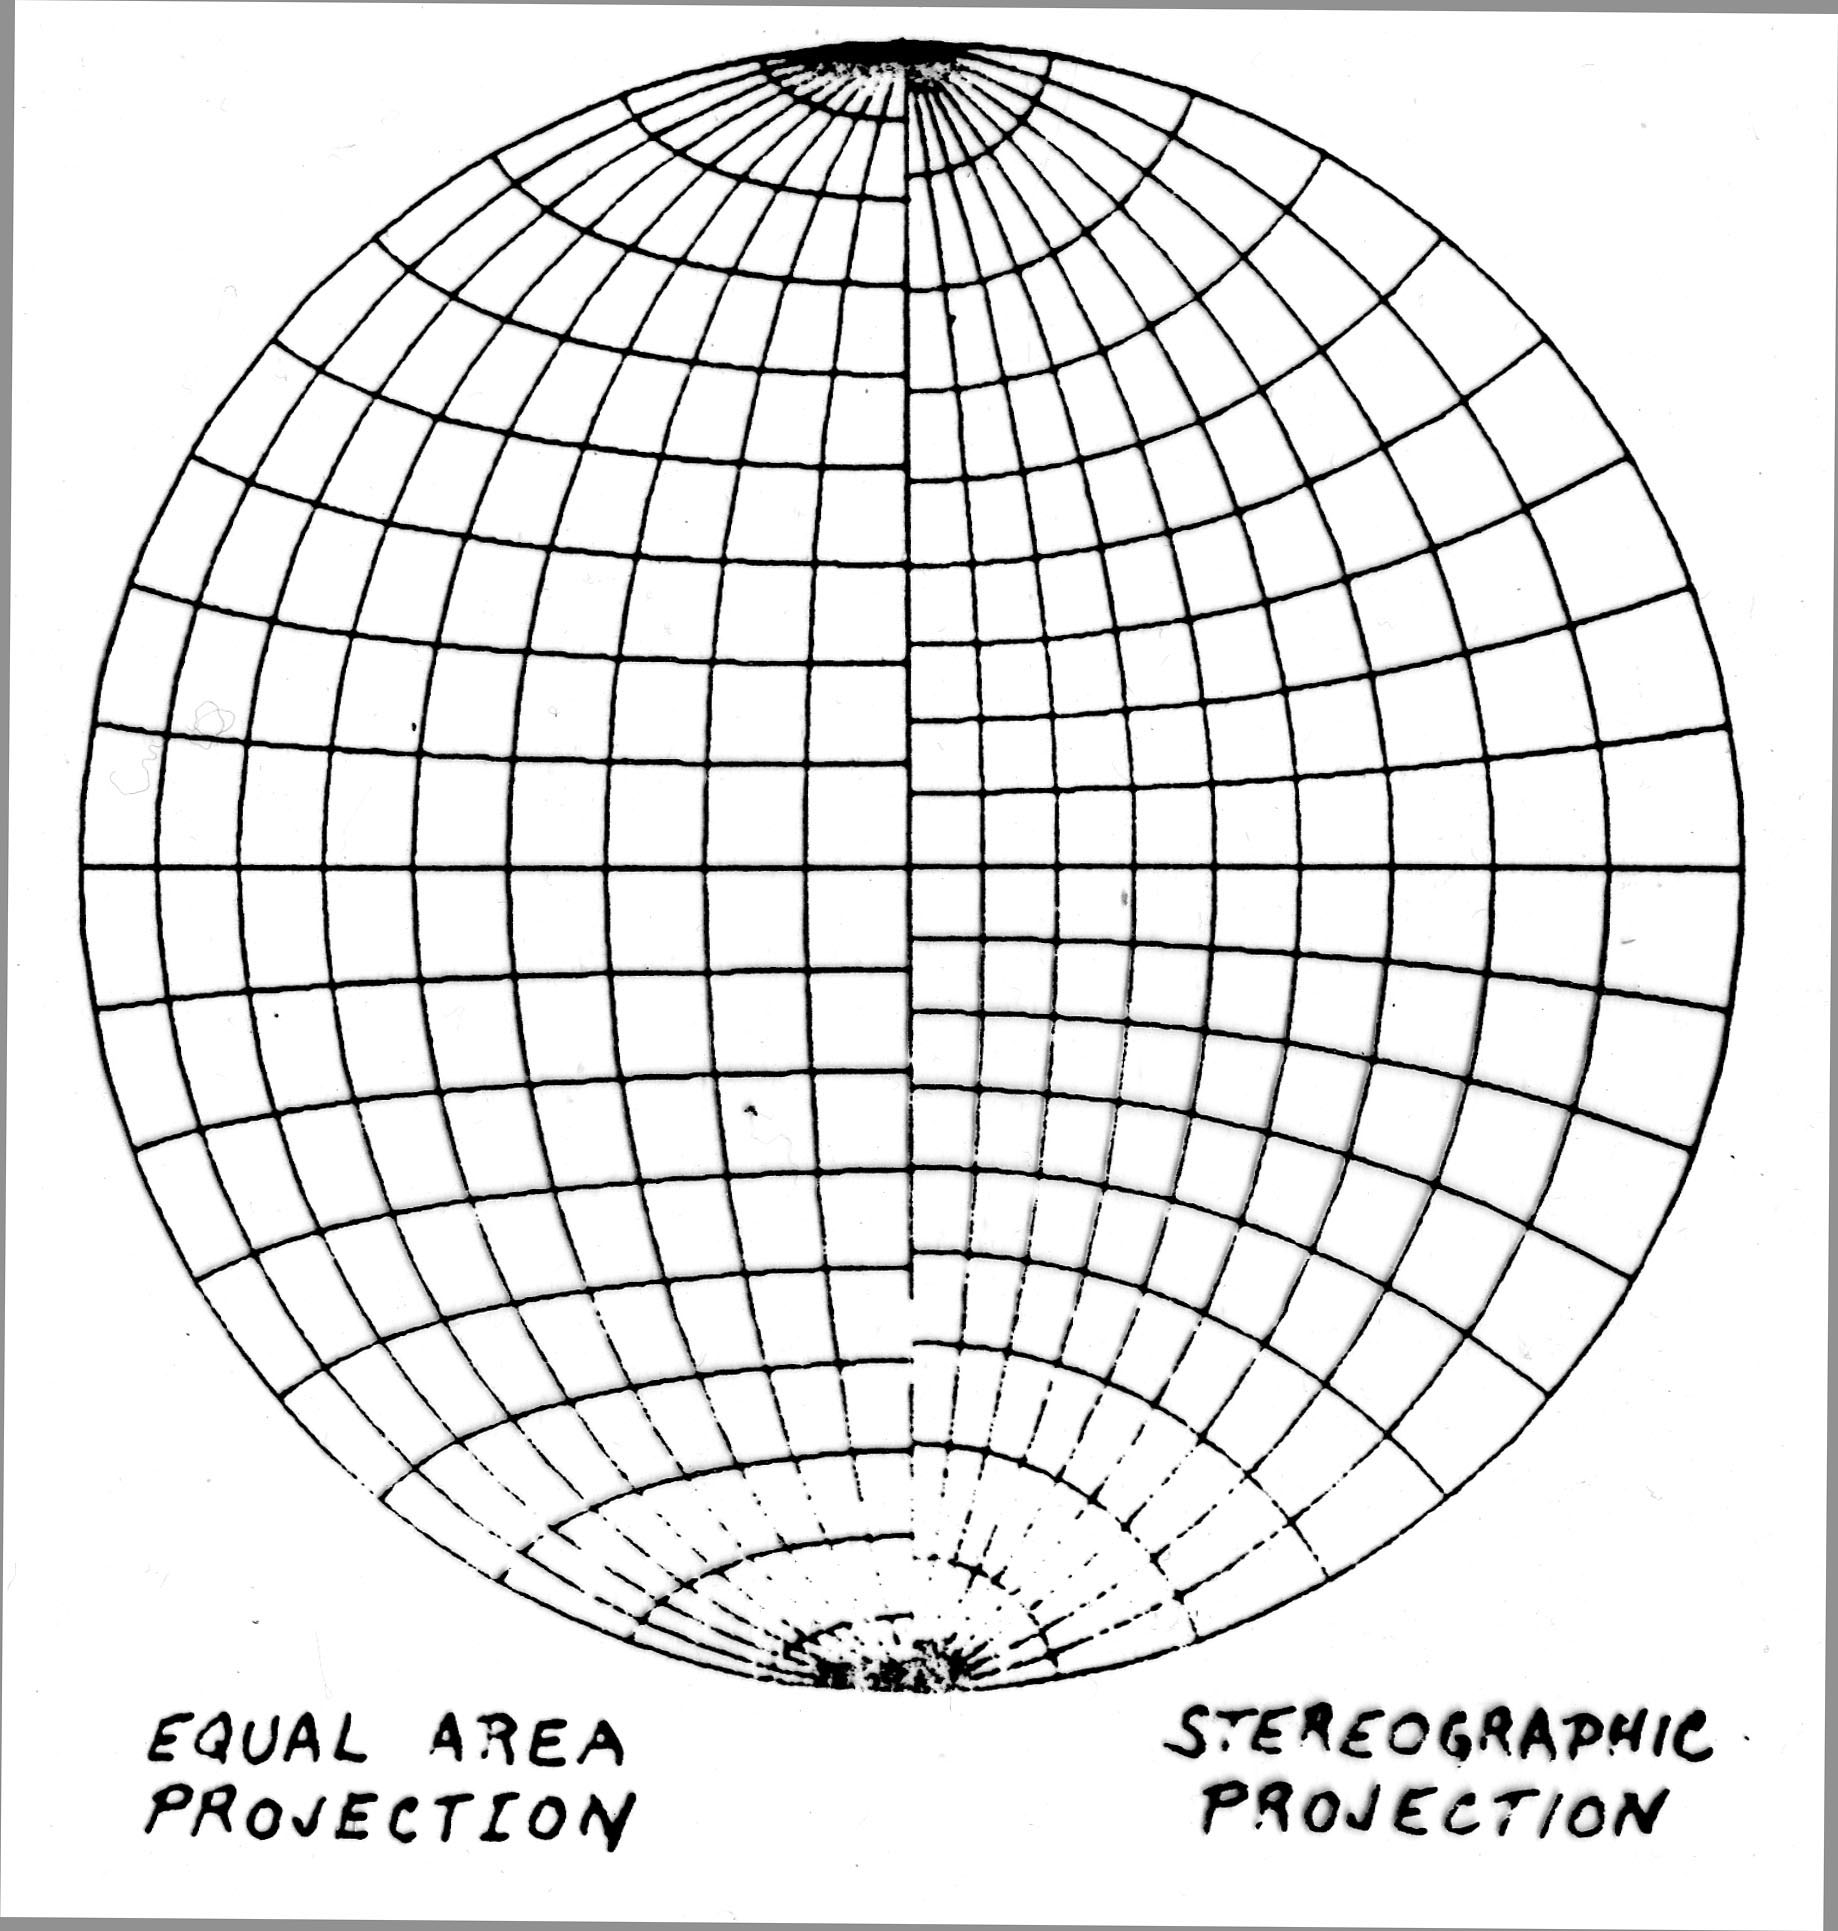
To represent planes and lines, and to play with them, we use « orientation diagrams », also called « stereonets ». The diagram itself represents the equatorial plane of a lower hemisphere (of unit radius). Any line D, whatever its orientation and position in space, is supposed to pass through the center (O). This line intersects the lower hemisphere at M (Figure). To represent a plane, we use its normal (line perpendicular to the plane), which then becomes a line D. In this case, M is called the pole of the plane. Therefore the orientation in space of any structural object (line or plane) is represented by a point on a lower hemisphere. M is projected into m in the equatorial plane of the hemisphere according to the Lambert’s projection (used in structural geology), a projection which is slighly different from the « stereographic » projection (formerly used by mineralogists). Hence, strictly speaking a « stereonet » is not necessarily stereographic ! The equatorial plane now contains data points coresponding to planes and lines having any orientation in space. The stereographic projection is also called equi-angular, and the Lambert projection is also called equi-area projection. Compare both types of projections in the following Figure. Since we use the equi-area projection, we often refer to orientation diagrams instead of « stereonets ».
The equal-area projection does not change the areas : S/s = constant whatever the orientation of S in space. The stereographic projection does not change the angles between lines whatever their position in space. Structural geologists who make statistics of orientations (density diagrams) need using the equal-area projection.
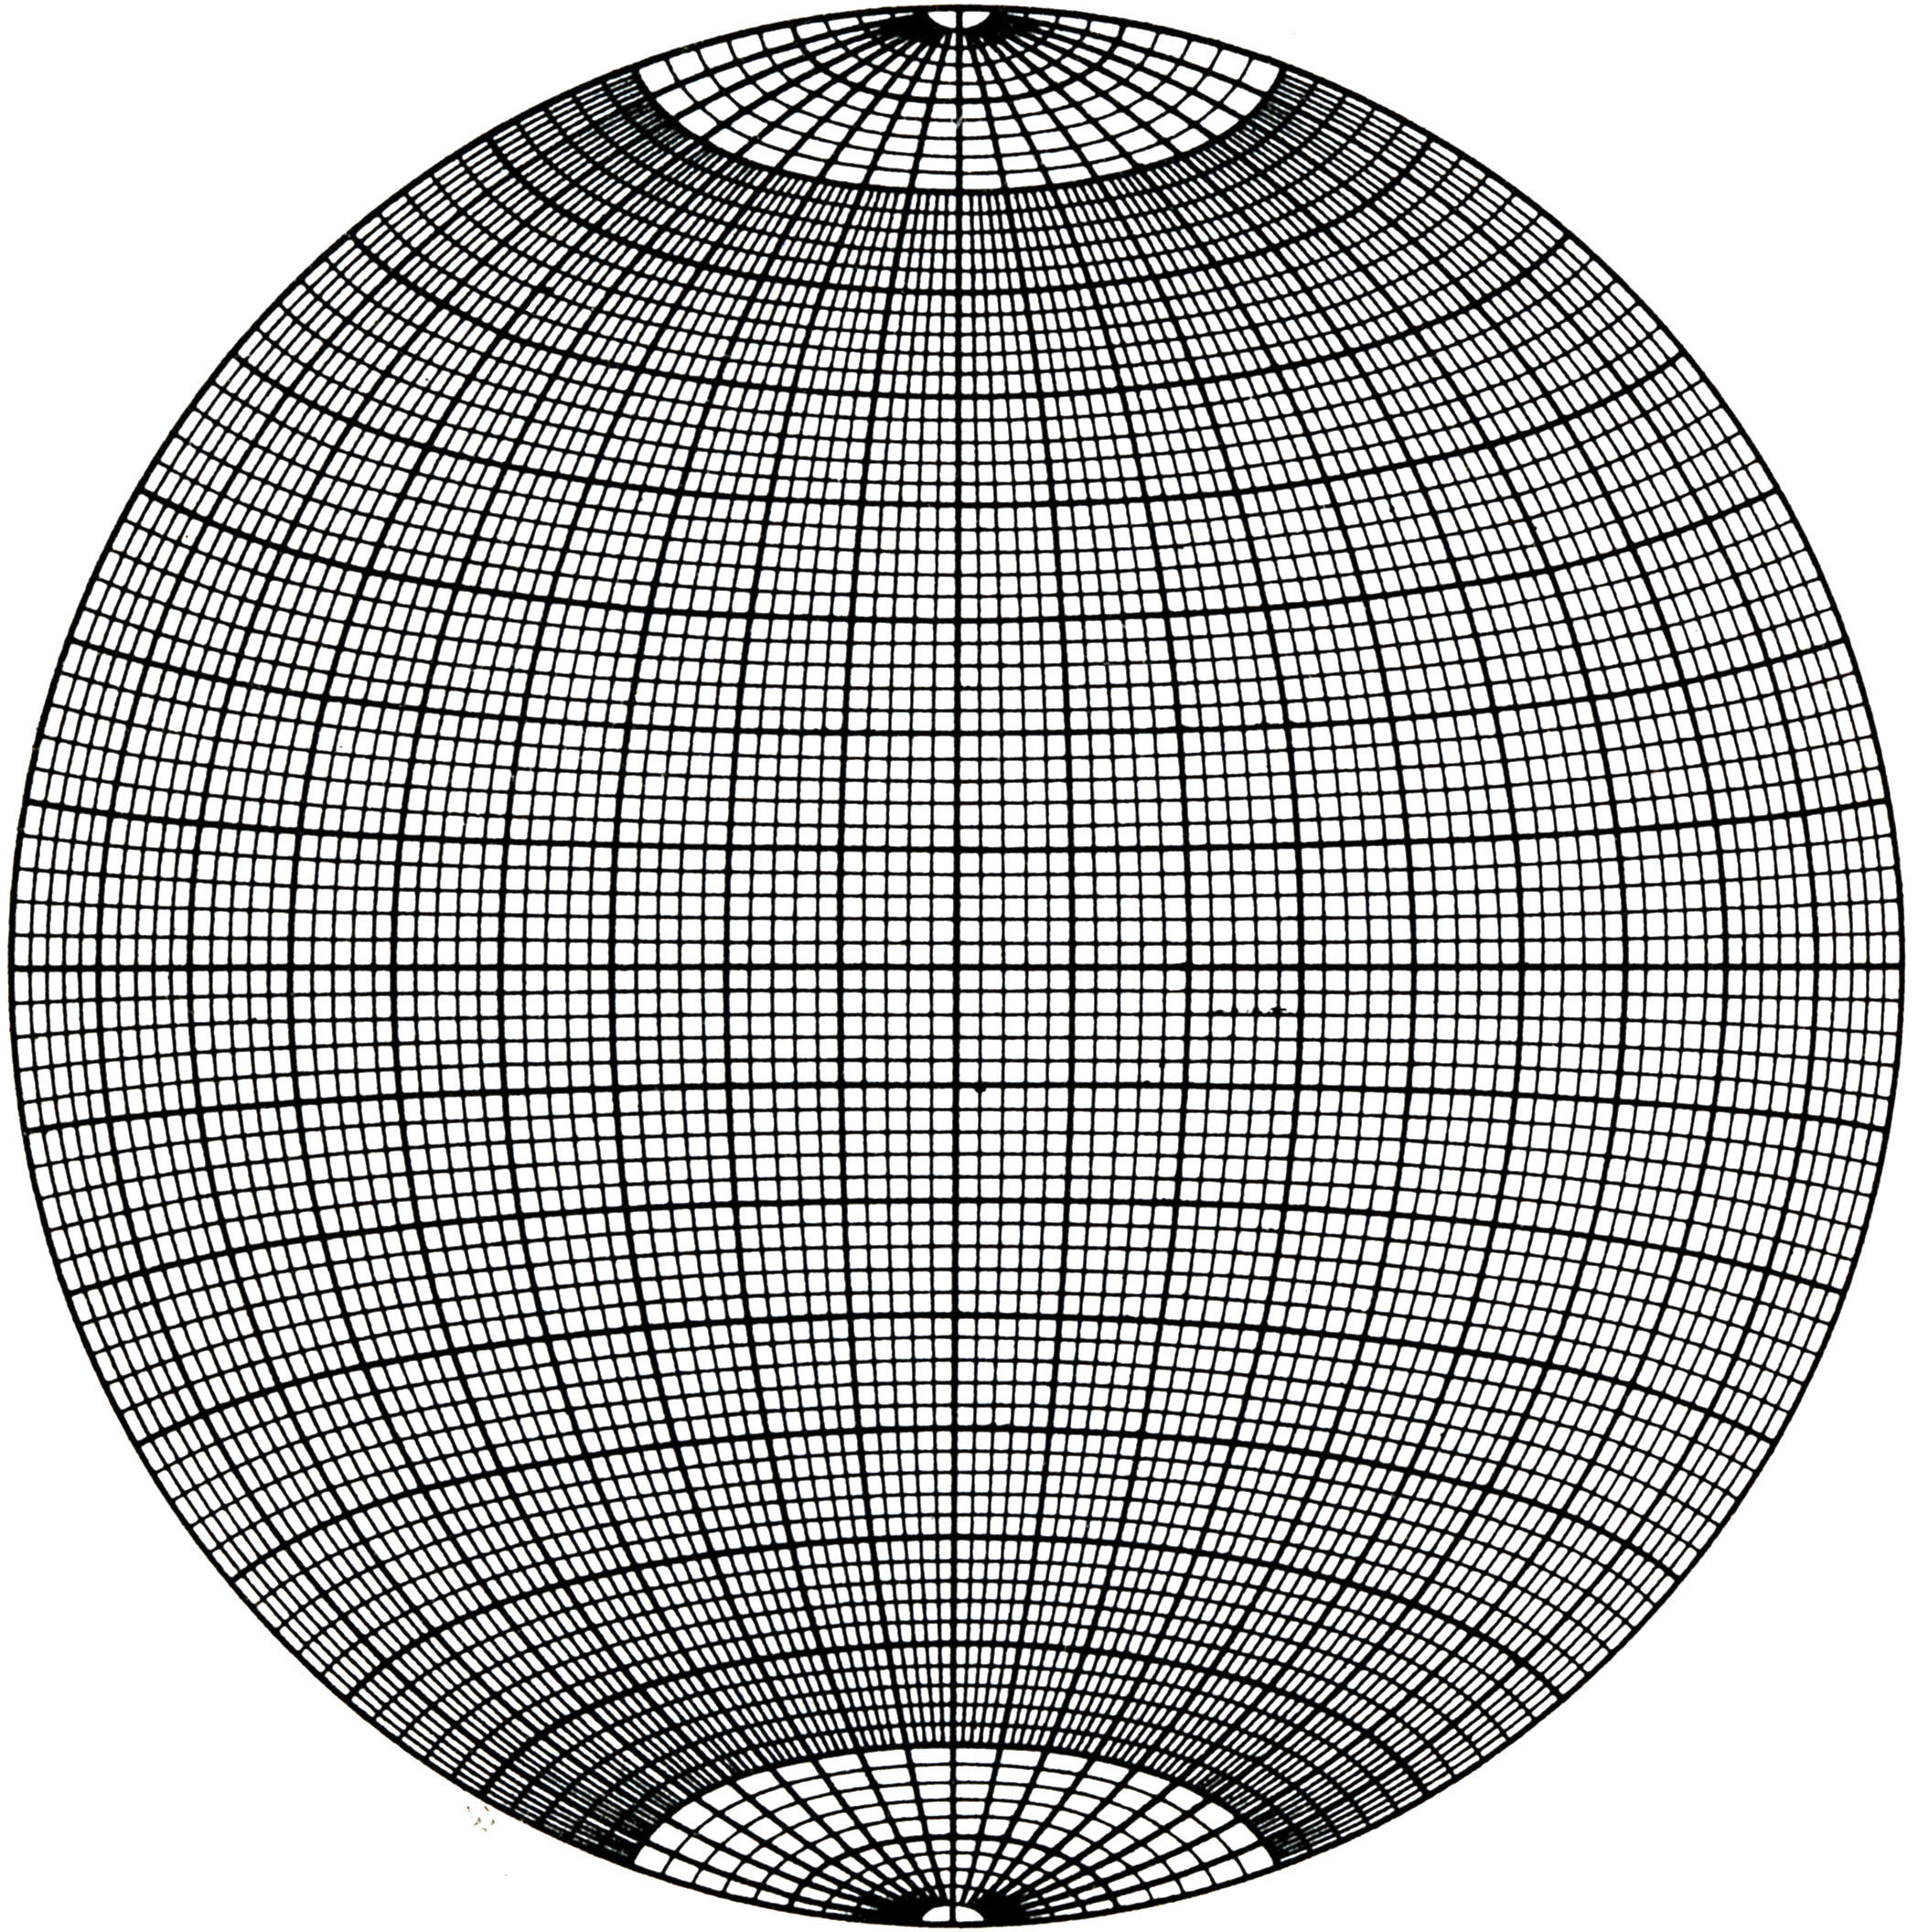
Equal-area projection (Lambert projection). To make easier the graphic use of the orientation diagram, the diagram is gridded using meridians and parallels, with 2° (thin lines) and 1° steps (bold lines).
In the « normal » use of stereonets, PP’ is vertical. Therefore the diagram represents the horizontal plane (map) and is oriented by the North. The meridians correspond to the intersection of planes containing the axis PP’, they are also called great circles. The parallels correspond to planes perpendicular to PP’, they are called small circles. The largest small circle, the one which contains the sphere center, is a great circle (the equator of the net). The grid has just one function : facilitate the graphic report of angles (of the orientations of planes or lines).
For example, if one needs to measure the angle between two lines in space (two points in the diagram), it is necessary to « align » them along the same great circle (put them on the same plane, meridian). This is why it is necessary to work on a transparent sheet (placed onto the orientation diagram and which can be rotated around a drawing-pin) in order to « align » the data-points along a meridian.
In certain circumstances, one may need to rotate the data-points around an axis. Easy rotation axes are the North-South line (follow the small circles …), and the vertical axis (rotation of the transparent sheet around the drawing-pin). Any other rotation is performed through a combination of these two rotation axes (N-S and vertical). Training … I- Mesurement of a plane : strike and dip. Trace the poles and the « cyclographic » projections of the following planes : 115° N 30° (strike 115° : from the North toward the east, or clockwise ; 30° : dip toward the North) ; 155° SW 30° ; 80° S 70° ; 25 W 10°. II- Measurement of a line : trend and plunge. Place the representative points of the following lines : 105° W 45° (trend 105° : is the strike of the vertical plane passing through the line, maesurement clockwise from the north ; plunge : W45° plunge toward the West) ; 130° E 15° ; 05° N 80° ; 90° W 50° etc … III- Determine the intersection between two planes (two methods). IV- Report graphically the elements of a fold (Figure ).
Date: 2015-01-29; view: 5186
|