CATEGORIES:
BiologyChemistryConstructionCultureEcologyEconomyElectronicsFinanceGeographyHistoryInformaticsLawMathematicsMechanicsMedicineOtherPedagogyPhilosophyPhysicsPolicyPsychologySociologySportTourism
Dividend-Yield-Plus-Growth-Rate or Discounted Cash Flow ApproachThe second approach to estimate the cost of equity bases on the assumption that the markets are at equilibrium and required rate of return equals to expected return. Let’s estimate inputs for the DCF model. Price of the stock=dividend expected to be paid at the end of the year 2012 divided by required rate of return minus expected growth rate in dividends. 1) Current stock price (20.11.2012)=48,67$ 2) Dividend growth rate estimation
Historical dividend growth rate[18] The data of history of dividend payments is available on the web-side dividata.com . As we can note, dividends were relatively stable in the past, and there are reasons to believe that this trends will continue. According to the Dividata.com, which offers dividend analysis and detailed dividend history, Disney Company has quite good latest estimation of analysts about[19]: - Overall Rating: Average The overall rating is a weighted average of the three other rated categories listed below. It is a general indication of the health of a dividend. - Dividend Yield: Fair This indicator measures a stock's current dividend yield, and compares it to similar stocks and historical yields. - Dividend History: Excellent The rating for dividend history is determined by looking back at the frequency and amount of historical dividend payments. - Dividend Increases: Above Average This indicator measures a stock's history of dividend increases; consistent increases over time will produce a favorable rating. Let’s use the divided amounts from the last 10 years to calculate historical average growth in dividends: Table 14 Historical average growth in dividends
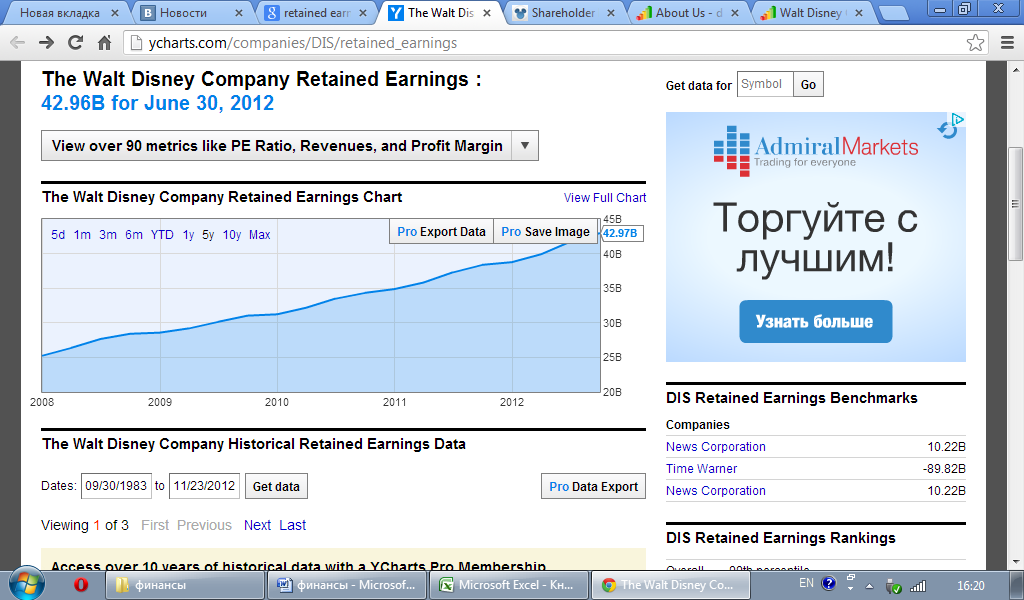
The historical growth rate equals to 11, 88% (g1). However we may note that dividends from the last year (2011) are significantly larger than that of 2010. The reason for that can be growing retained earnings[20]. Figure 7 Walt Disney Company Retained Earnings
Disney is a mature company, its earnings and dividend growth have been relatively stable in the past, and investors can expect these trends to continue, so, probably, the past estimates can be used as an estimate of the expected future growth rate.
Date: 2015-01-29; view: 1861
|