CATEGORIES:
BiologyChemistryConstructionCultureEcologyEconomyElectronicsFinanceGeographyHistoryInformaticsLawMathematicsMechanicsMedicineOtherPedagogyPhilosophyPhysicsPolicyPsychologySociologySportTourism
Stocks EvaluationIn order to evaluate Disney’s stocks we should understand the whole picture of the market. The amount of risk Disney stock contributes to a well-diversified portfolio is measured by beta coefficient. We can calculate it in a few simple enough steps: 1.calculate correlation between Disney’s stock return and the market return piM. 2.calculate standard deviation of Disney’s stock return σi 3.calculate standard deviation of the market’s return σiM
b = σi / σiM * piM
Calculation results can be seen in a table below. Table 9 Stocks Evaluation
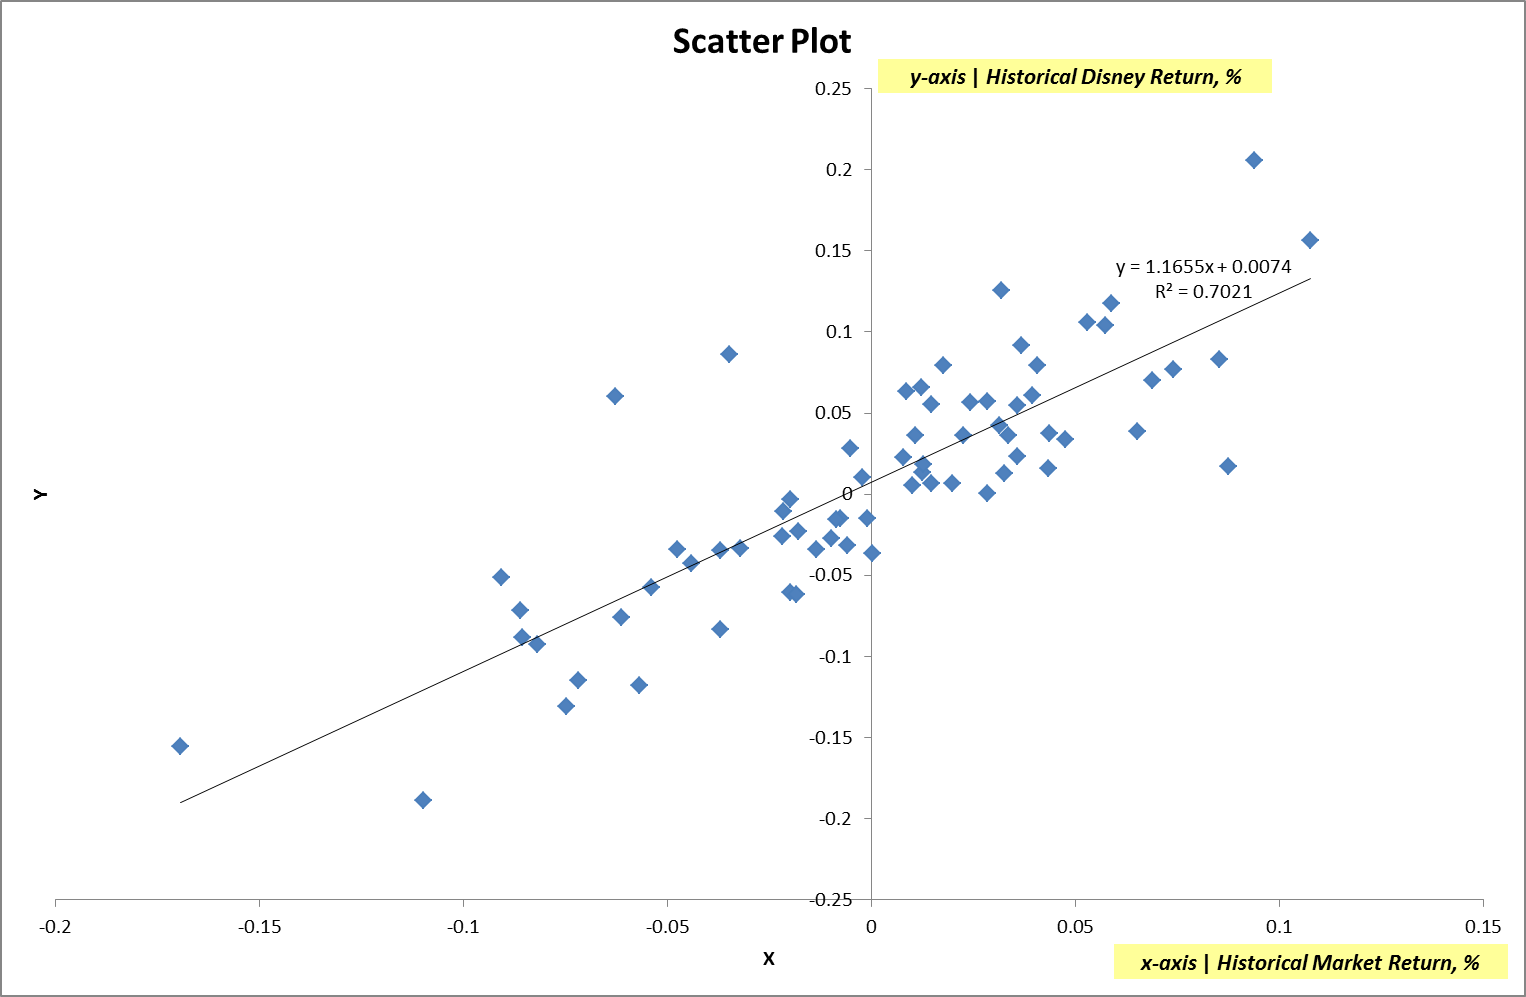
All the calculations can be also found in the Valuing_Stocks.xlsx file. Information about Disney’s stock returns for last 5 years was used. S&P 500 index returns for 5 years considered to be Market return. Annualized Standard Deviation for Disney's return is 7.27% vs. 5.23% for the market. The Range between Minimum and Maximum Returns for Disney is greater than the corresponding range for the market. All above is quite obvious, because the Market is a well-diversified portfolio, with much of risk being diversified. The Correlation Coefficient between Disney's returns and Market returns is 0.84, which is higher than correlation between typical stock and the market. Figure 5 Stock Characteristic Chart
Being a core component of a Capital Asset Pricing Model, Beta coefficient allows us to measure stocks volatility to the overall market. Disney's Beta is 1.17. It can be seen as a slope coefficient on a Stock Characteristic Chart above. It is more than 1, which means that Disney's returns move up and down by more than Market returns (on average). Our Estimated Beta equals to Beta defined by Yahoo! Finance. Table 10 Stock Evaluation 2
Using CAPM and Dividend Discount Model we can estimate then the required rate of return, expected rate of return and expected (intrinsic) stock value. § Required Rate of Return = 19.48% § Expected Rate of Return = 17.18%
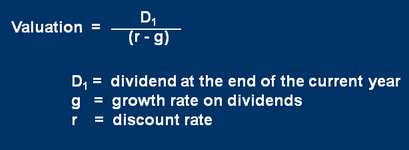
After calculating Required Rate of Return and Expected Rate of Return we can use Gordon growth model formula:
Figure 6 Gordon growth model formula
To obtain Disney’s stock intrinsic value for today's price: § Expected Stock Value (Intrinsic) = $18.63
As we can see, Stock is overvalued, as its intrinsic value is less than market price ($18.63 vs $48.67). However, there are number of reasons and causes why Disney’s stocks may have low expected stock value. For example, it can be due to investments in long-term goals. We can try to estimate Expected Stock Value not for 1 year (D1=$0.69), but for 8 years forward (D8=$1.93. While this evaluation is somehow rough and we are not taking into account all the events that may happen, it can be clearly seen, that Disney’s Expected Stock Value would be equals to or more than its Market Price in long-term perspective. Date: 2015-01-29; view: 902
|
 [9]
[9]