CATEGORIES:
BiologyChemistryConstructionCultureEcologyEconomyElectronicsFinanceGeographyHistoryInformaticsLawMathematicsMechanicsMedicineOtherPedagogyPhilosophyPhysicsPolicyPsychologySociologySportTourism
High-Luminance Color Appearance ModelHigh dynamic range imaging systems (HDR) have become more widely used. Evaluation of HDR-systems colorimetry is a complex task as the existing color appearance models are based on relatively low-luminance experimental data. For instance, the LUTCHI color appearance data were obtained for luminances up to 690 The model consists of three main components: chromatic adaptation, cone responses, and cortex responses for each perceptual color attributes. It aims to accurately predict lightness, colorfulness and hue, including the Hunt effect, the Stevens effect, and simultaneous contrast. Additional correlates of brightness, chroma, and saturation will be derived as well. As the focus of experiments [4.11] was not on chromatic adaptation, CIECAT02 chromatic adaptation transform [4.2] that has been shown to work well was adopted. To evaluate cone responses Tristimulus values are first transformed into LMS cone space using the Hunt-Pointer-Estévez (HPE) transform [4.2, 4.4]. The cones’ absolute responses are modeled as following:
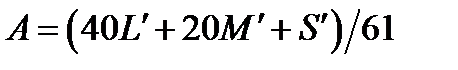
where The cone response then is converted into an achromatic signal A by averaging the contribution of each type of cone:
The lightness is derived by:
with
The values of the parameters are derived from experimental data, yielding As the perceived lightness values vary significantly with different media, the media-dependent lightness value is expressed as:
where the parameter E is different for each medium. A value of The brightness is defined as:
The parameter Preliminary red-green and yellow-blue opponent dimensions are calculated using:
Chroma is calculated as:
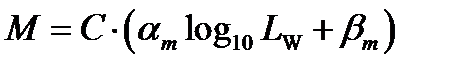
where Colorfulness is defined as:
where The other remaining quantity is saturation, which by definition is the colorfulness relative to its own brightness:
The hue angle is computed by:
Inverse model computation: 1. Compute achromatic white point 2. Compute brightness Q from lightness J:
3. Compute achromatic signal A from lightness J
4. Compute chroma C from colorfulness M
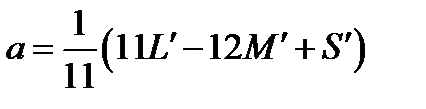
5. Compute color opponents a & b from chroma C and hue h
6. Compute cone signals LMS from the achromatic signal A and opponents a & b
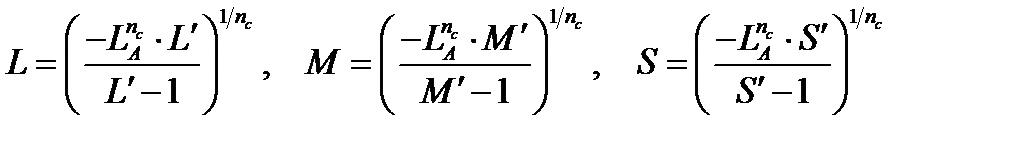
7. Compute cone signals LMS from nonlinear cone signals
8. Compute tristimulus Apply inverse CIECAT02 transform (using target white).
Date: 2014-12-22; view: 1226
|
 (except the small amount of data obtained at 1000 and 1280
 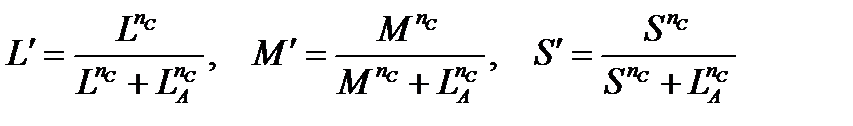 (4.83)
 is adaptation level value in
  is derived experimentally,
 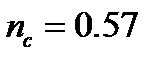 .
. (4.84)
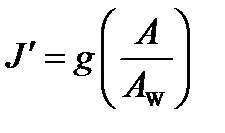 (4.85)
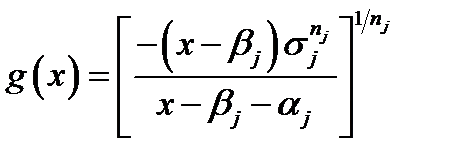 (4.86)
 ,
,  ,
,  ,
,  . It is interesting to note that
  may yield values below zero, in which case it should be clamped. This corresponds to the case where the observer cannot distinguish dark colors from even darker colors anymore.
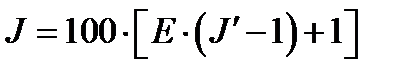 (4.87)
 corresponds to a high-luminance LCD display, transparent advertising media yield
  , CRT displays are
  , and reflective paper is
  . These parameters were derived from the LUTCHI data set.
 (4.88)
 is derived from experimental data,
 (4.89)
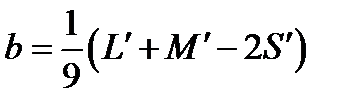 (4.91)
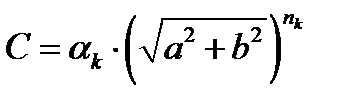 (4.90)
 ,
,  ,
, (4.91)
 is reference white luminance,
  ,
, 
 (4.92)
 (4.93)
 of the target device using equations 4.82 and 4.83.
 (4.94)
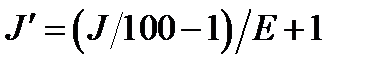 (4.95)
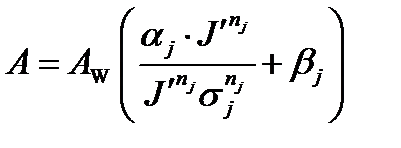 (4.96)
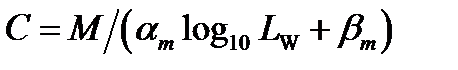 (4.97)
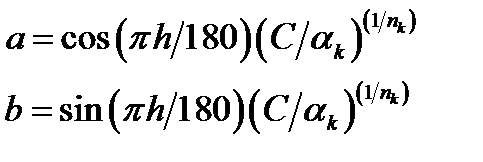 (4.98)
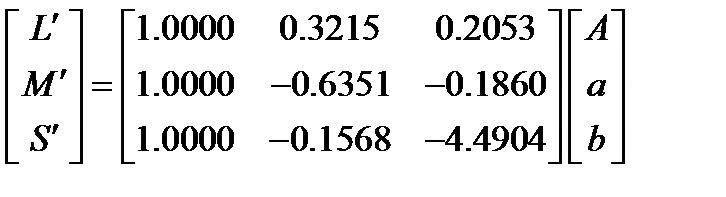 (4.99)
 (4.100)
 from cone signals LMS using the HPE transform.