All the colorimetric assessments based on CIECAM02 are usually expressed in or spaces. As it was shown [4.7 et al.], usage of ‒space gives more accurate predictions of color appearance. The following modifications of this space for large (CAM02-LCD), small (CAM02-SCD) and both small and large (CAM02-UCS) color differences (see Section 6) were proposed:
(4.79)
(4.80)
(4.81)
The coefficients for each version of UCS based upon CIECAM02 are the following:
Version of space
CAM02-LCD
CAM02-SCD
CAM02-UCS
0,77
1,24
1,00
0,007
0,007
0,007
0,0053
0,0363
0,0228
Correlation of values , is presented on Figures 4.4 and 4.5.
As follows from published results of studies [4.7 et al.], the estimations got with the use of these modifications show the best correlation with all available data on colour appearance and can be considered as basis for the further studies directed to progress of the television and related video applications and to progress colour appearance models for their use as part of the systems of image quality evaluation, in particular, evaluation of colorimetric quality.
It should be noted necessity of further colorimetric studies, related to the television specific taking into account characteristics of capture and reproduction, influencing on image quality, conditions of scenes capture and reproduction etc.
The results of testing published have shown that predictions obtained by using CIECAM02-based color spaces best match all available color appearance data and can be considered to become a base for further research work on development of TV and related video systems and on development of color appearance models for implementation them as the part of image quality assessment systems, particularly colorimetric quality assessment.
It should be noted, that there’s a need in further colorimetric research according to television specificity with taking into account the specific features of TV image capture and reproduction, influencing quality, the conditions of scene capture and reproduction and so on.
CAM02-UCS ( ) chromaticity diagram
CAM02-UCS () chromaticity diagram [4.6] is presented in Figures 4.6, 4.7 and 4.8. The figures demonstrate the dependence of colour appearance on adaptation level LA and relative luminance level Y in Luo et al. colour space.
In Table 4.1 the values of lightness of spectral color samples with given reference luminance for different adapting luminance levels are presented. The Table shows in what degree perceived lightness depends on sample colours. It also shows that the dependence of on is insignificant.
TABLE 4.1
Values of lightness for spectral colours
LA, cd/m2
White D65
Y=10
22.53
24.33
24.80
25.48
26.74
28.69
32.21
28.24
22.43
24.39
24.86
25.55
26.82
28.78
32.32
28.32
22.31
24.43
24.91
25.61
26.88
28.85
32.42
28.39
22.21
24.47
24.97
25.67
26.96
28.94
32.53
28.47
Y=50
54.52
59.08
60.22
61.86
64.88
69.55
77.94
68.49
54.19
59.11
60.27
61.93
64.96
69.65
78.06
68.57
53.82
59.13
60.3
61.98
65.02
69.73
78.18
68.64
53.48
59.16
60.35
62.03
65.10
69.81
78.29
68.71
Y=100
79.50
86.31
87.97
90.36
94.75
101.52
113.63
100.00
78.92
86.27
87.95
90.00
94.75
101.53
113.64
100.00
78.30
86.22
87.92
90.35
94.76
101.54
113.68
100.00
77.72
86.17
87.90
90.34
94.76
101.55
113.70
100.00
It is seen from pictures and table, that:
- the change of adaptation luminance results in the perceptible changes of the perceived color, namely mainly lightness , colorfulness and hue in CAM02-UCS space, however, less than change of lightness , colorfulness and hue in CIECAM02 space;
- with increase of relative stimulus luminance dependence of colour variation on adaptation luminance carries stable character and changes with variation of , and this dependence is nonlinear.
Combined influence of surround and adapting luminance. On Figures 4.9‒4.18 the projections of chromaticity diagram are presented in CAM02-UCS space on the plane of coordinates . The figures demonstrate change of colour appearance depending on surround (dark, dim, average) and adapting lightness of for given stimulus luminance relative values Y.
As follows from figures, the change of surround may substantially influence on colour appearance, as it is visible from dependence of projection of chromaticity diagram on the plane of coordinates , and this influence shows up in a most degree at large stimulus luminance levels, and change of both colorfulness and perceived hue takes place.
These changes of colour appearance can be critical for video applications in that viewing conditions substantially differ on transmitting and receiving ends, that results in impairment of colour rendition.
General evaluation of colour appearance change
It is possible to give more complete quantitative evaluation of possible colour appearance changes with change of adapting luminance and surround, by evaluation of the change of chromaticity coordinates in CAM02-UCS space as distance between points on the plane of coordinates for different combinations of adapting luminance and of surround for the compared stimuli. Examples of quantitative evaluation of values of parameters and distance are presented an in Tables 4.2‒4.11.
In Table 4.2 the values of colorfulness of spectral color samples with given reference luminance for different adapting luminance levels are presented. The Table shows in what degree perceived colorfulness for different sample colours depends on .
The dependence of perceived colours on may be shown with use the criterion:
, (4/82)
where , , ‒ differences of coordinates of color space , , for adapting luminance levels and .
The values of are shown in the Table 4.3.
TABLE 4.2
Values of colorfulness for spectral colours
LA, cd/m2
White D65
Y=10
107.85
74.09
74.809
84.67
78.923
62.074
136.12
1.1869
116.26
80.137
80.897
91.601
85.468
67.513
147.68
0.9578
122.97
84.992
85.778
97.146
90.719
71.999
157.087
0.6228
130.07
90.14
90.951
103.022
96.291
76.772
167.024
0.2472
Y=50
166.41
115.84
116.93
132.73
124.36
98.15
213.39
1.852
178.83
124.93
126.03
143.1
134.26
106.46
230.59
1.489
188.67
132.2
133.3
151.35
142.17
113.31
244.52
0.966
199.04
139.89
140.97
160.07
150.55
120.59
259.18
0.382
TABLE 4.2 (End)
Y=100
199.43
139.75
140.96
160.16
150.5
119.05
257.26
2.23
213.93
150.49
151.68
172.37
162.25
128.99
277.47
1.791
225.38
159.08
160.21
182.08
171.64
137.18
293.8
1.16
237.4
168.12
169.19
192.3
181.55
145.87
310.91
0.458
TABLE 4.3 Values of criterion
6.05
5.58
5.58
5.84
5.80
6.17
6.92
6.52
6.15
6.11
6.31
6.36
6.98
7.18
6.67
6.31
6.24
6.43
6.54
7.27
7.21
TABLE 4.4 Colour coordinates of monochromatic colour points of chromaticity diagram for Y=10
Surround
LA, cd/m2
average
39.30
‒53.99
38.21
‒38.27
‒22.71
34.89
‒42.77
‒5.74
35.68
45.48
‒57.84
36.39
‒43.25
‒25.45
35.04
‒48.30
‒6.37
35.86
dim
38.28
‒54.65
45.95
‒38.48
‒22.91
41.62
‒43.01
‒5.85
42.36
43.94
‒59.00
44.58
‒43.46
‒25.68
41.77
‒48.55
‒6.50
42.55
dark
36.46
‒53.88
51.64
‒37.55
‒22.43
46.53
‒41.98
‒5.78
47.22
41.63
‒58.52
50.62
‒42.46
‒25.18
46.69
‒47.44
‒6.44
47.41
Surround
LA. cd/m2
average
‒42.87
18.09
36.54
‒29.41
34.25
38.29
‒0.79
38.66
40.61
‒48.13
20.54
36.76
‒32.89
38.91
38.55
‒0.67
44.37
40.90
dim
‒43.12
18.07
43.19
‒29.64
34.19
44.87
‒0.99
38.42
47.09
‒48.41
20.50
43.41
‒33.17
38.81
45.12
‒0.91
44.04
47.36
dark
‒42.16
17.55
48.00
‒29.04
33.19
49.60
‒1.15
37.11
51.70
‒47.39
19.91
48.22
‒32.58
37.70
49.84
‒1.12
42.57
51.96
TABLE 4.4 (End)
Surround
LA. cd/m2
W
average
54.87
32.62
44.89
‒1.00
‒0.59
1.18
60.65
36.61
45.26
‒0.21
‒0.12
0.24
dim
54.55
32.15
51.10
‒1.52
‒0.90
1.81
60.31
36.10
51.44
‒1.03
‒0.61
1.22
dark
53.09
30.99
55.46
‒1.13
‒1.14
2.30
58.79
34.86
55.77
‒1.69
‒1.00
2.01
TABLE 4.5 Values of distance between position of points of monochromatic colors of chromaticity diagram for the values of adapting lightness , equal 20 and 200 cd/m2,for stimulus luminance, equal to 10 cd/m2
Surround
average
7.50
5.68
5.57
5.80
5.82
5.72
7.03
dim
7.26
5.70
5.58
5.82
5.82
5.63
6.99
dark
7.02
5.63
5.50
5.72
5.74
5.47
6.89
TABLE 4.6 Values of distance between position of points of monochromatic colors of chromaticity diagram for average and dim surround for the values of adapting lightness , equal 20 and 200 cd/m2, for stimulus luminance, equal to 10 cd/m2
7.83
6.73
6.69
6.65
6.58
6.48
6.24
8.41
6.74
6.70
6.65
6.57
6.47
6.21
ТАBLE 4.7 Values of distance between position of points of monochromatic colors of chromaticity diagram for combined adapting luminance and surround for stimulus luminance, equal 10 cd/m2
Conditions of viewing (adapting luminance and surround) on capturing and reproduction ends
– average – dim
12.39
8.51
8.4
8.51
8.53
8.59
9.55
– average – dark
18.16
13.18
13.01
13.07
13.02
13.02
13.89
– average – dim
9.34
9.12
9.01
9.15
9.03
8.63
9.12
TABLE 4.8 Colour coordinates of monochromatic colour points of chromaticity diagram for Y=50
Surround
LA, cd/m2
average
49.29
‒65.84
75.23
‒49.95
‒29.39
70.29
‒55.90
‒7.51
71.60
56.64
‒69.14
71.90
‒55.49
‒32.30
70.32
‒61.97
‒8.17
71.70
dim
46.59
‒64.77
80.30
‒48.42
‒28.59
74.39
‒54.17
‒7.37
75.50
53.16
‒68.70
77.99
‒53.88
‒31.48
74.42
‒60.16
‒8.05
75.59
dark
43.59
‒62.81
83.75
‒46.24
‒27.39
77.13
‒51.72
‒7.12
78.10
49.50
‒67.12
82.06
‒51.58
‒30.25
77.18
‒57.58
‒7.81
78.19
Surround
LA, cd/m2
average
‒55.56
23.54
73.02
‒38.31
44.81
75.85
‒1.24
51.51
79.52
‒61.22
26.26
73.16
‒42.02
49.99
76.02
‒1.17
57.95
79.72
dim
‒53.93
22.69
76.72
‒37.24
43.16
79.16
‒1.44
49.30
82.34
‒59.53
25.34
76.84
‒40.96
48.21
79.31
‒1.42
55.54
82.51
dark
‒51.62
21.57
79.17
‒35.73
41.02
81.36
‒1.61
46.58
84.19
‒57.14
24.13
79.29
‒39.44
45.91
81.50
‒1.64
52.59
84.34
Surround
LA, cd/m2
W
average
68,26
41,09
86,05
‒1,55
‒0,92
1,85
74,04
45,48
86,30
‒0,32
‒0,19
0,38
dim
65,93
39,35
87,92
‒2,21
‒1,31
2,65
71,65
43,64
88,12
‒1,49
‒0,89
1,77
dark
63,09
37,29
89,13
‒2,68
‒1,58
3,23
68,75
41,48
89,30
‒2,33
‒1,38
2,80
TABLE 4.9 Values of distance between position of points of monochromatic colors of chromaticity diagram for stimulus luminance, equal 20 и 200 cd/m2 for stimulus luminance, equal 50 cd/m2
Surround
average
8.71
6.26
6.11
6.28
6.37
6.44
7.26
dim
7.99
6.18
6.03
6.19
6.27
6.24
7.15
dark
7.50
6.05
5.90
6.09
6.14
6.01
7.04
TABLE 4.10 Values of distance between position of points of monochromatic colors of chromaticity diagram for average and dim surround for the values of adapting lightness , equal 20 and 200 cd/m2 for stimulus luminance, equal to 50 cd/m2
5.84
4.44
4.27
4.13
3.85
3.59
3.46
7.03
4.48
4.29
4.15
3.89
3.70
3.52
TABLE 4.11 Values of distance between position of points of monochromatic colors of chromaticity diagram for combined adapting luminance and surround for stimulus luminance, equal 50 cd/m2
Conditions of viewing (adapting luminance and surround) on capturing and reproduction ends
– average – dim
13.8
8.96
8.71
8.86
8.9
9.04
10.24
– average – dark
18.73
12.49
12.13
12.26
12.19
12.23
13.96
– average – dim
5.55
6.07
5.86
5.80
5.53
5.02
4.72
Comparison of values with the evaluation of occurrence on image
In [4.8] the correlation between value of characterizing divergence between the colors of the original scene and its image presented Table 4.11, is published. It is seen that distortions can vary at levels from barely noticeable to impermissible.
Data of works [4.9, 4.10], presented on picture 4.19, are comparable with this evaluation.
Comparison of evaluations resulted in tables 4.2‒4.11 with data of table 4.12 and picture 4.19 testifies that in the conditions of independently changing surround of image and adapting luminance at the transmitting side and on a receiving side can result in distortions of colour rendition from a level unnoticeable or barely noticeable to the level of impermissible impairment of image colorimetric quality.
TABLE 4.12
Correlation of distance and colour rendition impairment
, CIE units
Image impairment evaluation
Unnoticeable
Barely noticeable
Bad
Imperceptible
ICEsaver result
Expert evaluation
Usual viewer
ΔЕ
1 2 3 4 5 6 7 8 9 10 11 12 13 14
Visual
unnoticeable
Noticeable but acceptable
Unacceptable
Figure 4.19 ‒ Occurrence of image impairment in dependence of colour deflection levels
 or
or  spaces. As it was shown [4.7 et al.], usage of
  ‒space gives more accurate predictions of color appearance. The following modifications of this space for large (CAM02-LCD), small (CAM02-SCD) and both small and large (CAM02-UCS) color differences (see Section 6) were proposed:
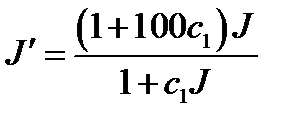 (4.79)
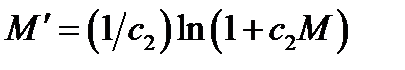 (4.80)
 (4.81)


 ,
,  is presented on Figures 4.4 and 4.5.
 ) chromaticity diagram
 of spectral color samples with given reference luminance
  for different adapting luminance
  levels are presented. The Table shows in what degree perceived lightness
  is insignificant.
 results in the perceptible changes of the perceived color, namely mainly lightness
  , colorfulness
  and hue
  in CAM02-UCS space, however, less than change of lightness
  , colorfulness
  and hue
  in CIECAM02 space;
 dependence of colour variation on adaptation luminance
  carries stable character and changes with variation of
  , and this dependence is nonlinear.
 . The figures demonstrate change of colour appearance depending on surround (dark, dim, average) and adapting lightness of
  for given stimulus luminance relative values Y.
 , and this influence shows up in a most degree at large stimulus luminance levels, and change of both colorfulness
  and perceived hue
  takes place.
 between points on the plane of coordinates
  for different combinations of adapting luminance
  and of surround for the compared stimuli. Examples of quantitative evaluation of values of parameters
  and distance
  are presented an in Tables 4.2‒4.11.
 of spectral color samples with given reference luminance
 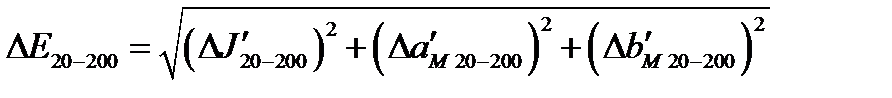 , (4/82)
 ,
,  ,
,  ‒ differences of coordinates of color space
  ,
,  ,
,  for adapting luminance levels
  and
and  .
. are shown in the Table 4.3.
 of monochromatic colour points


 between position of points of monochromatic
 , equal
 between position of points of monochromatic colors
 , equal 20 and 200 cd/m2, for stimulus luminance, equal to 10 cd/m2

 between position of points of monochromatic colors of chromaticity diagram for combined adapting luminance and surround for stimulus luminance, equal 10 cd/m2
 and surround) on capturing and reproduction ends

 – average
  – dim
– dim
 – average
  – dark
 – average
  – dim
– dim
 of monochromatic colour points of chromaticity diagram


 between position of points of monochromatic colors of
 between position of points of monochromatic colors
 , equal 20 and 200 cd/m2 for stimulus luminance, equal to 50 cd/m2

 between position of points of monochromatic colors of chromaticity
 with the evaluation of occurrence on image
 characterizing divergence between the colors of the original scene and its image presented Table 4.11, is published. It is seen that distortions can vary at levels from barely noticeable to impermissible.
 and colour rendition impairment
 , CIE units