In the candidate selection step, to select the optimal number of the most similar candidate SRs ( ) with the query SR in the hierarchical matching structure, we evaluate our proposed matching structure based on performance and processing time for different numbers of the most similar candidate SRs that remain at the end of candidate selection module.
Table 3 presents the accuracy rate and processing time of our proposed hierarchical matching structure for different values of for each query image. These candidate SRs are refined in the corner matching and SR matching steps by using corner point angles, centroid distance and differential tangent angle features, so that only one enrolled SR in the database is introduced as identified SR with query SR. Therefore, we define which provides high accuracy and of course less computing time as it is expressed in Table 3.
Table 2: The retrieval results of the query SR in the first 5 most similar candidate SRs.
Arrangements
Accuracy rate (%)
{Filled area, Perimeter, Eccentricity, Solidity, Major axis length, Minor axis length, Equivalent diameter}
93.73
{Filled area, Eccentricity, Solidity, Perimeter, Major axis length, Minor axis length, Equivalent diameter}
93.40
{Filled area, Perimeter, Solidity, Eccentricity, Equivalent diameter, Major axis length, Minor axis length}
90.60
{Filled area, Solidity, Perimeter, Eccentricity, Minor axis length, Major axis length, Equivalent diameter}
91.60
{Filled area, Major axis length, Minor axis length, Eccentricity, Perimeter, Solidity, Equivalent diameter}
93.66
Table 3: Accuracy rate and processing time of our proposed hierarchical matching structure for different values of .
Number of SR candidates
Accuracy rate (%)
Processing time (sec)
M=8
93.86
0.1746
M=7
93.73
0.1553
M=6
93.73
0.1290
M=5
93.73
0.1124
M=4
93.26
0.0949
3.2.3. Parameter Setting of SR Matching
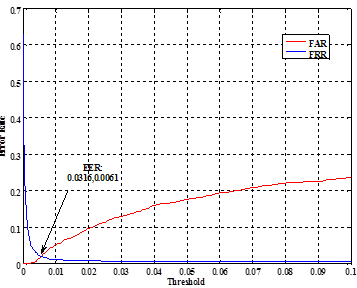
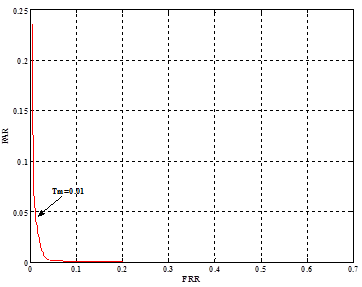
As previously mentioned in section (2.3.1), at first we chose five candidate SRs among all enrolled SRs in the database which showed the most similarity with the query SR. Then, after matching their corner points by using corner matching algorithm, the differential tangent vectors are employed to find the best candidate SR by Eq. (12). Finally, by the weighted corner angle feature (Eq. (13)), the query SR is rejected or accepted to one of the similar candidate SRs. In Eq. (13), threshold should be set to an optimal value which the best performance of SR matching algorithm is obtained. For this purpose, the matching results of SRs related to ten biggest SRs of the images in an experiment similar to experiment A with different rotation and translation values are provided in Fig. 9. In this experiment, False Accept Ratio (FAR) demonstrates the rate of matched SRs mistakenly and False Reject Ratio (FRR) shows the rate of rejected SRs mistakenly in the SR matching algorithm. Fig. (9-a) shows FAR and FRR curves this experiment for different values of . The lowest error rate is achieved for . But in our application, this value is set to where FRR is lower than and FAR is still fairly low, because in this stage we should reduce the FRR of the matched SRs of the query with the enrolled SRs in the database while FAR doesn’t impose more computational complexity and processing time to the decision making scenario. Figs. (9-b) and (9-c) show curves of genuine accuracy versus FAR and FAR versus FRR for different values of , respectively.
(a)
(b)
(c)
Fig. 9: ROC curves related to results of the SR matching algorithm. (a) Error Rate, (b) Genuine accuracy versus FAR, (c) FAR/FRR.
 ) with the query SR in the hierarchical matching structure, we evaluate our proposed matching structure based on performance and processing time for different numbers of the most similar candidate SRs that remain at the end of candidate selection module.
 which provides high accuracy and of course less computing time as it is expressed in Table 3.
 should be set to an optimal value which the best performance of SR matching algorithm is obtained. For this purpose, the matching results of SRs related to ten biggest SRs of the images in an experiment similar to experiment A with different rotation and translation values are provided in Fig. 9. In this experiment, False Accept Ratio (FAR) demonstrates the rate of matched SRs mistakenly and False Reject Ratio (FRR) shows the rate of rejected SRs mistakenly in the SR matching algorithm. Fig. (9-a) shows FAR and FRR curves this experiment for different values of
  . But in our application, this value is set to
  where FRR is lower than and FAR is still fairly low, because in this stage we should reduce the FRR of the matched SRs of the query with the enrolled SRs in the database while FAR doesn’t impose more computational complexity and processing time to the decision making scenario. Figs. (9-b) and (9-c) show curves of genuine accuracy versus FAR and FAR versus FRR for different values of