CATEGORIES:
BiologyChemistryConstructionCultureEcologyEconomyElectronicsFinanceGeographyHistoryInformaticsLawMathematicsMechanicsMedicineOtherPedagogyPhilosophyPhysicsPolicyPsychologySociologySportTourism
Control Group Experimental Group
· track runner (17) 1 track runner (17)
· strong math student (18) strong math student (18)
· IB male (17) IB male (17)
· Spanish-speaking female (16) Spanish-speaking female (16)
D. Method: Materials
This section is a list of materials developed for use in the experiment. Basic materials such as tables, chairs, paper, and pencil should not be listed. This may be a bullet list of items.
· Any written materials like a list of words to recall that were specially developed for this experiment should be listed. A sample copy should be in the appendix.
· Standardized briefing and debriefing notes and informed consent letters should be included in an appendix.
· Stopwatch and other items used in your experiment should be listed here.
· Describe what is used, not how it is used.
· Be sure you plan ahead for any special equipment you will need (video recorder, music system, DVD player and TV, stopwatch, etc.)
· Be sure you have copies of whatever forms, scripts, or documents you will need
D. Method: Procedure
Write this section in past tense.
You must carefully and accurately describe how the experiment was carried out step-by-step. Enough detail should be provided so that another researcher could replicate the experiment. Procedures may be written either as a paragraph or in bullet point format.
·
| Scoring D. Method: Materials & Procedure: (2 marks) q Make sure the procedural information is relevant, clearly described, and easily replicable q Necessary materials have been included and referenced in the appendices. q Ethical guidelines were followed. |
· If you are writing in bullet points, make sure that enough details are included for someone to replicate your procedure (I might make them do that!)
· Write in chronological order. Be clear and concise.
· State whether you ran your experiments in groups, pairs, or individually.
Ethical Guidelines
Ask yourself….have I considered all ethical concerns?
· I have not caused any stress, anxiety, pain, or discomfort.
· I have asked everyone to sign an “informed consent” BEFORE beginning my experiment.
· I provided an adequate description to my participants of what they would be expected to do and what I was testing for.
· I used only mild (or no) deception, and I cleared up any misinformation or mild deception during the debriefing (after the experiment).
· I am careful with all data so that confidential information does not get lost, left, stolen, or discovered (laptop, lists, thumbdrives, signed forms, etc).
· I keep my own thoughts and lips sealed around others (and online) for confidentiality.
· I have tried to avoid all confounding variables from interfering with my research—including demand characteristics. I believe that any variables at this point are out of my control and are unlikely to alter or affect my results.
· I read a statement that debriefed all participants equally and thoroughly after my experiment was over. I gave participants a chance to ask questions, and a way to contact me with further questions or concerns.
Results: Section E & F
There are 2 different sections for the results. First you must conduct your actual experiment and collect all of the data. Your raw data will go in the appendix (at the back). Your finished data and explanations will go into two sections.
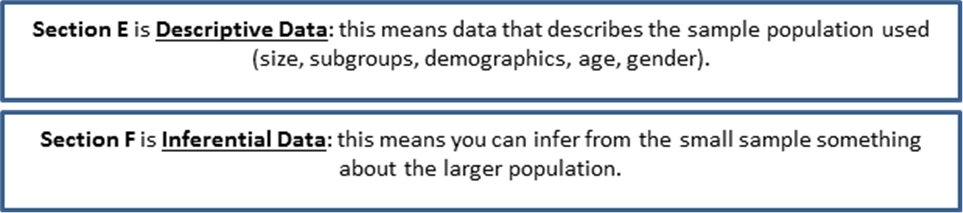
E. Results: Descriptive
The results should be stated in two ways: “say it” and “show it”
· A narrative (written) form--a written statement (example: “the mean number of words recalled by the experimental group (X1) was 2.5 (X1=2.5).”
· A graphic form that enhances the reader’s understanding and supports the text. These are graphs that the reader should be able to understand just by looking at the graph or the table. Tables could include mean scores or frequency of behavior.
· Be sure every part of your graphs are carefully labeled. There are many computer programs that will make these graphs for you (like MS Excel or PowerPoint).
· The data should be reported in a way that reflects the aim of the research hypothesis (ex: you were trying to prove condition x over y, so make sure your graph shows x over y).
· Raw data should not be included here, but must be in the appendix. Only summarized data should appear in the results section.
· A lower-case n refers to the number of participants (n=20)
The data collected in research can represent different levels of detail (referred to as the level of measurement of the data). There are 4 levels of measurement you can use:
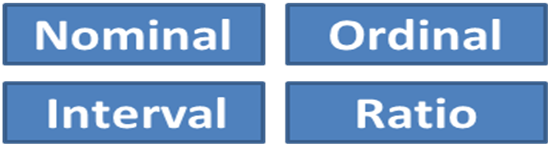
Nominal data: example: smokers and non-smokers; cat people versus dog people.
· Simplest data to collect.
· As you record data, put it into categories (yes/no) and you simply count how many fall into each category.
· Nominal level provides the least amount of information of all.
· Only the mode can be used as a means of central tendency.
· Nominal data have fewer descriptive statistics that may be calculated.
· It is not recommended to carry out research that only produces nominal data.
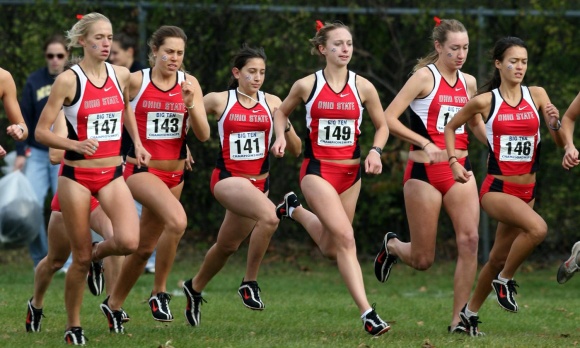
Ordinal data: example: track runners are ranked as number 1, 2 or 3.
· Put into rank, or order from smallest to biggest, or first to last.
· We cannot say anything about how much better # 1 did compared with # 2 and 3--only who came in 2nd and 3rd.
· The difference between each score may not be equal.
· An example could be a Likert scales (strongly agree, agree, disagree, strongly disagree).
Interval data: Peter is 179 cm tall, Pierre is 180 cm. Pierre is the tallest; Peter is the smallest
· Other examples: temperature (1-100); IQ scores (100); #s recalled on a memory test
· Data is measured on a scale which has precise and equal intervals.
· Data at the interval level carries much more information than ordinal data.
· The mean, median, and mode may be calculated for interval data.
· If you rank interval data they become ordinal data.
 Ratio data: example: weight in grams is a ratio scale; 20 miles are 2x as far as 10 miles.
· Ratio data have the characteristics of interval data, plus they have a true zero point (you can’t have a negative mile, or a negative weight).
· There is an equal distance (intervals) between each data point.
· Ratio measurements lend themselves to more effective statistical analysis.
· Nearly all measures of both central tendency and dispersion can be calculated.
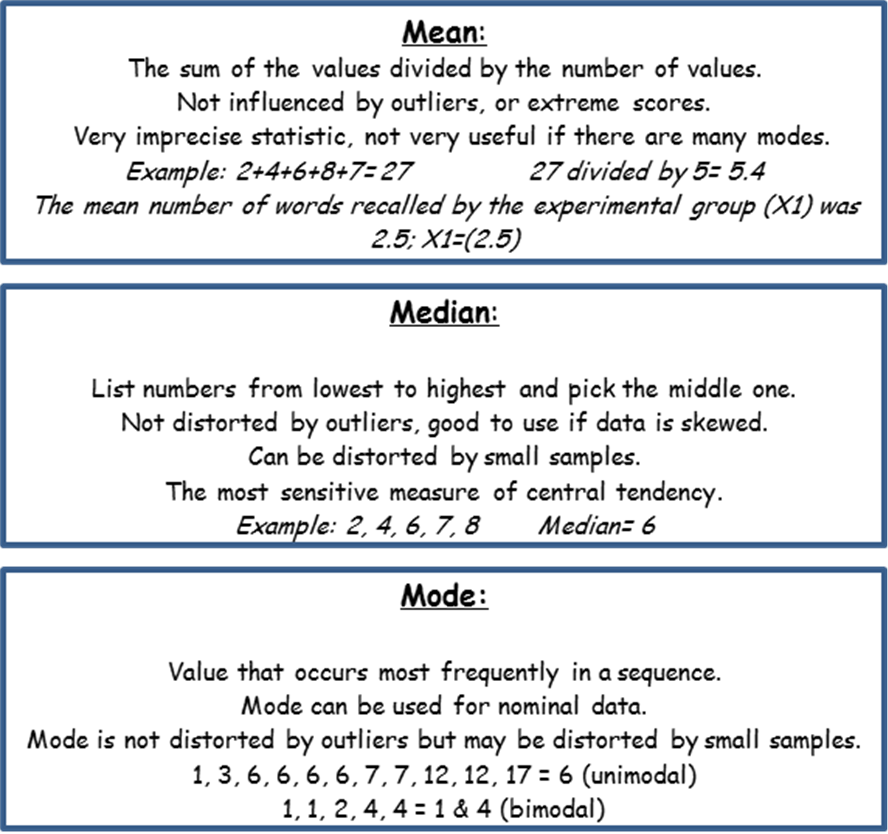
Measures of Central Tendency
The measure of central tendency tells you something useful about a distribution—but it only describes one aspect. You should calculate both the central tendency and dispersion (if the level of measurement of your data allows it). This depends on your data and whether you chose the mean, median, or mode.
Date: 2015-01-11; view: 1650
| <== previous page | | | next page ==> |
| Commentary 2: Macroeconomics | | | Measures of Dispersion |