CATEGORIES:
BiologyChemistryConstructionCultureEcologyEconomyElectronicsFinanceGeographyHistoryInformaticsLawMathematicsMechanicsMedicineOtherPedagogyPhilosophyPhysicsPolicyPsychologySociologySportTourism
Geographic Information Systems for managing the ecosystem and living resources of the White Sea
An efficient tool for studying the ever changing natural environment is the Geographic Information System (GIS). GIS is intended for the collection, system- atization, storage, processing, analysis, assessment, and display and distribution of data, and thus for the provision of information and knowledge about spatially and temporally-varying phenomena (Tikunov, 1991). GIS is used for the solution of a broad spectrum of scientific and practical tasks that are, in some way or another, related to spatially distributed data. GIS is very frequently used for decision-making support, in part because a thematic map is a very efficient way of displaying diverse and extensive data required to support decision making.
This chapter describes a GIS developed within the scope of the WHITESEA project. The general structure of the system is described in Section 8.1. Section 8.2 describes the specialized software used for formation of the so-called data warehouse. Section 8.3 describes the formation of digital maps for the region. Section 8.4 describes a dedicated data analysis using the ArcView GIS. Section 8.5 presents an analysis of remote sensing data using the IDRISI GIS. How the informa- tion system may be used to support decision making is discussed in Section 8.6, followed by some conclusions in Section 8.7.
8.1 SYSTEM STRUCTURE
The system developed here is designed for both utilization of multifaceted informa- tion about the White Sea region, and use of this information at various levels, such that raw measurement results can further be converted into a form appropriate for many different purposes (e.g., decision-making support, mass-media applications, and education). Proceeding from the above, one can single out three levels of use for GIS information for solving various problems relevant to the study of the White Sea region, all three differing in the method by which the data provided is employed.
Figure 8.1. The three levels of the information system.
These levels may be described as: (1) raw observational data (e.g., field and remotely sensed); (2) Regional economic and environmental information; and (3) integrated knowledge (Figure 8.1).
A distinctive feature of the developed system is the great diversity of data available, with regard to both origin and formats. The information system is intended to ensure work with several types of data, viz.:
1 Satellite remote sensing data.
2 Sub-satellite observation data obtained by making use of ground-based monitoring techniques (e.g., from on board a research vessel).
3 Archived data for the social and economic development in a region.
4 Statistical data for the technogenic impact upon the regional environment. 5 Model simulation results.
6 Metadata (i.e., information describing the data).
The specific features of the integration of all these types of data into an informa- tion system are presented in Figure 8.2.
Use of these four main file formats is facilitated by the system:
1 .HTML, for text documents with illustrations that are standard for this type of document (.GIF, .JPG).
2 .MDB, for relational databases.
3 .IMG (IDRISI GIS format), for spatially referenced raster data.
4 .SHP (ArcView GIS shape-files), for spatially referenced vector data.
The conversion of data presented in other formats into the standard formats of information systems is accomplished with the help of modules from a local system described in the next sub-section. Aside from data conversion, a data clean-up procedure is performed (i.e., checking data integrity and consistency, and removing obvious errors). This makes it possible to form a data warehouse, which
Sec. 8.1]
|
 System structure 307
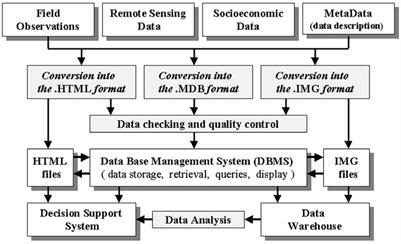
Figure 8.2. General structure of the information system.
is recorded on CD-ROM during the first stage of the systems development. The term data warehouse stands for a subject-oriented, integrated, chronology-keeping, non- volatile collection of data in support of any kind of analysis or decision-making process (Lvov, 1997). Two main difficulties may arise when creating a data warehouse intended for decision-making support:
1 Problem uncertainty: what particular kind of information may be required for the support of decision-making in the ever, and rapidly, changing environment; what goals and tasks will be pressing in the future, etc.
2 Data inhomogeneity: different and often inadequately described file formats of the input data; results of measurements are obtained with various instruments and thus are often inconsistent, etc. In many cases it is easier to repeat an expensive experiment rather than try to extract the results from the archived data provided by an earlier, similar experiment.
Therefore, the first stage in the creation of a data warehouse is data integration. When the initial data are integrated into the warehouse, self-consistent rules should be observed for naming and time ascription of input data; unified measurement units and presentation systems (e.g., attributes, metadata) should be introduced for similar-type objects. In addition, for integration of environmental data, a unified system of geographical coordinates is required.
In the second stage (Figure 8.1) the data are analyzed with the help of a GIS such as ArcView 3.x, ArcGIS 8.3, and IDRISI. The specific features of such an analysis are considered in Sections 8.4 and 8.5.
The final stage of data integration into an information system consists of the transformation of the entire collected material into appropriate internet documents.
8.2 SOFTWARE FOR THE FORMATION OF THE DATA WAREHOUSE
A special software package is created to manage temporal databases, which appear in the development of a finite product, and to integrate the results of the analysis into a data warehouse. The following tasks are usually resolved during this process:
• Data conversion into standard formats.
• Data clean-up (checking for possible errors).
• Input of data into a relational database.
• Visualization of spatially referenced data.
The structural scheme of such software (Johannessen et al., 1997) is presented in Figure 8.3. A package of applied programs ensuring the management of the data warehouse has been written in C\C++ and Visual Basic. Modules affecting the search for information in the data warehouse have been developed and written in the Visual Basic. Programs performing both the conversion of ecological monitoring data and other statistical data into unified formats, and the visualization of raster data have been written in C\C++. The package consists of a number of autonomous programs or standard program modules, which facilitates its development and mod- ification.
A Graphical User Interface (GUI) for the package has also been developed in

Figure 8.3. Structure of the local information system software.
Sec. 8.3]
|
 Formation of digital maps 309

Figure 8.4. Illustration of the GUI.
Visual Basic. The GUI is illustrated in Figure 8.4. As seen, the package has a simple, standard user-friendly interface.
8.3 FORMATION OF DIGITAL MAPS
Digital maps for the White Sea region were formed on the basis of two sources: (1) DCW (Digital Maps of the World) maps (Digital Maps .. ., 1993); and (2) ESRI digital maps (ESRI .. ., 2003).
The ESRI digital maps are stored on a CD in ArcView format (shape-files), and compilation of digital maps on this basis, for the White Sea region, is reduced to clipping one theme based on another. The DCW digital maps at our disposal were in ArcInfo format intended for workstations. Therefore, a special procedure was developed to utilize the files (Rastoskuyev et al., 2003) - presented in Figure 8.5.
In the first stage, on the basis of the initial DCW digital maps (Digital Maps .. ., 1993) intended for workstations, areas of interest are identified with appropriate boundaries chosen for the maps. These areas are exported into the ArcInfo exchange format used for data transmission between a workstation and personal

Figure 8.5. Steps required to create digital maps.
computers. Then, on the basis of the PC ArcInfo selected areas, GIS ArcView shape- files are formed.
The DCW maps unfortunately contain numerous errors from different origins. Some of the errors are due to the fact that the DCW maps were based on topo- graphic maps drawn 10 years ago or more, so quite a substantial portion of informa- tion is outdated. Other errors are relevant to the specific features of the process of joining of fragments, into which the initial DCW maps has been subdivided (5o lat. x 5o long.). When the fragments are unified following the ArcInfo mapioin command, not all lines showing fragment boundaries are removed automatically, and some remain on the unified maps. Besides, there are some errors that are caused by an inadequate control of the process of map digitization. Because of all these errors, map editing becomes a necessity.
Map editing includes two obvious tasks: (1) to remove needless points, lines, and polygons; and (2) to add new ones. These tasks are solved using a standard ArcEdit module in ArcInfo. There also is an alternative procedure of error removal via use of the ArcView package (which is specifically relevant to the ArcView 3.x versions, where the possibility of editing spatially referenced data is provided). The easiest procedure is that of removal of excessive details - it is sufficient to introduce a special error code in the attributive table.
On the basis of shape-files imported into ArcView, maps for various purposes can be formed rather easily. It should be noted that recently a large number of exchange format files or even shape-files per se became available via the Internet. These were developed on the basis of the same DCW map. These files can sometimes be used, which makes the formation of digital maps less laborious and time- consuming due to the exclusion of the first stages (Figure 8.3).
Sec. 8.4]
|
Data analysis using the ArcView GIS 311
8.4 DATA ANALYSIS USING THE ARCVIEW GIS
Figure 8.6 shows the structure of a data warehouse in the left-hand window of the ArcCatalog GIS ArcView 8.3 module. The presented version of the data warehouse comprises two bases of geo-data: (1) WseaR1.mdb, formed on the basis of the DCW maps, as described above; and (2) WseaR2.mdb, whose spatial data have been cut out of the ERSI digital map of Europe. In the window, a part of the continent of the WseaR2.mdb geo-database is seen: the ws_cit (cities of the region) point feature class and the ws_cut polygonal clipping area.
There is a remote sensing section included in the warehouse. One sub-section accommodates data on sea surface temperature (SST) obtained at the Institute for Space Studies (ISS), RAS from processed NOAA AVHRR data. The data cover the period from July, 1996 to February, 2001. In addition, some NOAA AVHRR data were obtained for the period 1981-2001. Each month is represented by several scenes (3-15) obtained at different times. The main format of data storage is .TIFF, but a certain part of the data has been converted into IDRISI format. To accelerate the search for desired data, satellite images have been converted into .GIF format. These images and their descriptions have been copied in a special sub-section /SST/. The / NOAA/ sub-section accommodates the AVHRR data (Channels 4 and 5) for an earlier time period (1991-1993); the /SeaWiFS/ sub-section is a depository of processed SeaWiFS images for the period 1998-2000.
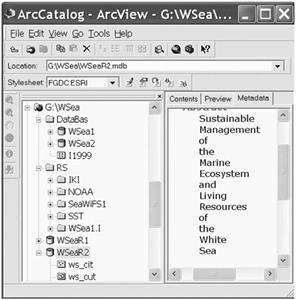
Figure 8.6. Structure of a data warehouse.
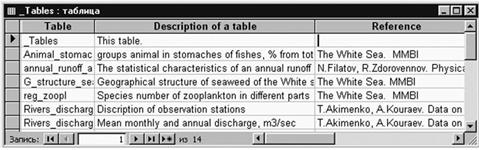
Figure 8.7. The base Wsea1.mdb database (a fragment).

Figure 8.8. The base Wsea2.mdb database (a fragment).
The Wsea1.mdb database (Figure 8.7) has been mainly compiled on the basis of published data. The Wsea2.mdb database (Figure 8.8) contains tables from the annual and final reports relevant to the WHITESEA Project. The export of informa- tion from these databases to the base of geo-data is accomplished by means of dBASE IV format files. As a rule, exported data are stored in the geo-data base in the form of independent tables, and when thematic maps are created, they are joined to the attributive tables using the ioin command.
Analysis of data by means of GIS ArcView aims, above all, at the study of the Russian regions that are adjacent to the White Sea: the Archangelsk Oblast, the Republic of Karelia, and the Murmansk Oblast (Figure 8.9). The map of the White Sea region presented in Figure 8.9 has been compiled on the basis of the WseaR2 geodatabase described above. The layers constituting the map contain data on the main cities and towns, the biggest rivers and lakes, and the main roads. The map has been compiled in the Albers equal-area conic projection with the central meridian at 40oE and two standard parallels, viz. 60oN and 70oN (Kennedy and Copp, 1998). Figures 8.10 and 8.11 show two examples of thematic maps of the White Sea region. The first map presents the data on the GRP for the period 1994-1998. The data used for compiling the map (Table 8.1) have been provided by Filatov et al. (2002). The industrial structure and output in 1999 for the Russian Federation regions related to the White Sea Basin are presented in Figure 8.11. The data
|
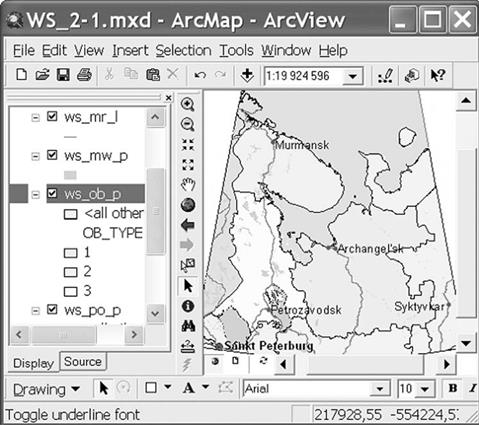
Figure 8.9. Map of the White Sea region as displayed in the window of the ArcMap module.
provided by Filatov et al. (2002) are presented in Table 8.2, and the description of the columns is given in Table 8.3.
In conclusion, it should be mentioned that the examples presented above do not in the least exhaust the GIS ArcView facility for data analysis. Apparently, the most promising area of GIS analysis, in the context of sustainable regional development, is relevant to mapping the changes taking place both in ecosystems, and in the socio- economic sphere of the subjects of the Russian Federation associated with the White Sea Basin.
8.5 ANALYSIS OF REMOTE SENSING DATA USING THE IDRISI GIS
Processing and analysis of remote sensing data includes standard stages (such as preliminary and thematic data processing, analysis of the results, and so on) whose realization depends, on the one hand, upon the particular problem to be solved, and
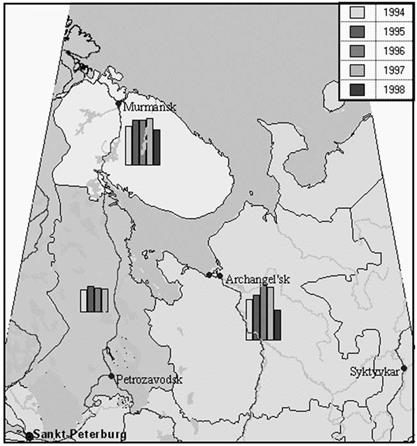
Figure 8.10. Nominal GRP in the White Sea region in the 1994-1998 period in current prices (US$ billion).
on the other, upon the hardware and software available. In the processing of remote sensing data the ERDAS package is usually used jointly with ArcInfo GIS and ArcView. However, in the case of the White Sea, the simpler IDRISI GIS was used (Eastman, 1995). It should be noted that the main stages of remote sensing data analysis depend more on the problem to be solved than on the GIS used. A technical scheme developed here for processing remote sensing data in conjunction with a raster GIS is presented in Figure 8.12.
In the first stage of working with the data, the latter should be imported and transformed into the formats of the corresponding GIS. In this case, the input data are spaceborne images stored on CD-ROM or other digital media. Apart from satellite data, at this stage geographical maps (digital and paper) are usually imported since they serve as indispensable sources of a priori information for proces-
|
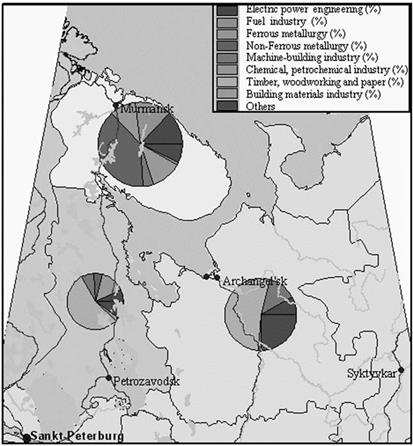
Figure 8.11. The White Sea region: structure and output of the regional industry in 1999 (% of the total).
sing remote sensing data. The results of processing in this stage are raster and vector data presented in the format of the relevant GIS.
Preliminary processing of remote sensing data precedes the image analysis and is aimed at the correction of these images, taking into account the data specific features and analysis goals. In the first place, a geometric correction is usually performed. It consists of changing the position of the image elements (pixels) in order to transform the image to a particular geographical coordinate system. If geographical informa- tion systems are used for data processing and analysis, this stage is imperative. Apart from the geometric correction, in many cases it is worthwhile to accomplish the correction of brightness level and atmospheric optical impact. The brightness correc- tion implies modification of signal values inherent in each pixel, and is aimed at expanding the useful information from satellite data. The best-known methods of
Table 8.1. Nominal GRP in 1994-1998 in current prices ($US billion).

Region 1994 1995 1996 1997 1998
| Arkhangelsk Oblast | 2.87 | 3.2 | 3.91 | 3.71 | 2.12 |
| Murmansk Oblast | 2.8 | 3.22 | 3.21 | 3.29 | 2.52 |
| Republic of Karelia | 1.61 | 1.81 | 1.74 | 1.64 | - |
Table 8.2. The structure and output of the industry in the White Sea region in 1999 (% of the total).
Region VOLUME ELECT FUEL F MET NF MET ENGIN CHEM TIMBER BUILD
| Murmansk Oblast | 35,247 | 39 4 | ||||||
| Republic of Karelia | 18,469 | 5 7 |
Arkhangelsk Oblast 27,185 8 0 0 0 13 0 53 1
Table 8.3. Description of the columns in Table 8.2.
Type of industry Description
VOLUME Volumes of industrial production (millions of rubles)
ELECT Electric power engineering (%)
FUEL Fuel industry (%)
F MET Ferrous metallurgy (%)
NF MET Non-ferrous metallurgy (%)
ENGIN Engineering industry, machine-building industry (%)
CHEM Chemical, petrochemical industry (%)
TIMBER Timber, woodworking, pulp and paper (%)
BUILD Building materials (%)
brightness correction are contrast stretching and spatial filtering. Atmospheric cor- rection also leads to some modification of spectral values of the signal associated with each pixel. However, unlike other methods, atmospheric correction requires the use of a priori information about the optical properties of the atmosphere; it is intended to remove the distortions of images arising from radiation scattering and absorption produced by atmospheric gases and aerosols.
Thematic processing (analysis) of data is aimed at the formation of layers of digital raster maps. Thematic processing employs diverse mathematical methods designed for enhancing the information content of raw data. Most often, map algebra is used for this purpose (i.e., modules are developed to perform certain algebraic operations, such as summation, multiplication, etc., over one or several images). An example can be given of the calculation of SST from satellite data in the infrared spectral region, which is accomplished making use of the IDRISI IMAGE
|
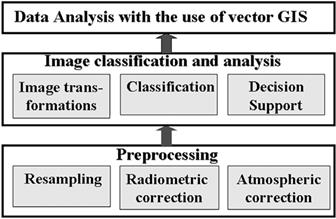
Figure 8.12. Main stages of data analysis by means of a raster GIS.
CALCULATOR module. There are a number of standard modules for such opera- tions, for instance: COMPOSIT for the formation of a composite image (color composite) from the data of several spectral channels in the visible region; NDVI for the calculation of the normalized difference vegetation index (NDVI) from the data of two channels in the red and near-infrared spectral regions. The raster GIS can be useful for conducting mathematical and statistical operations over one or several images.
The classiEcation procedure is the most important task of thematic processing. The goal of classification is separation of image elements and their partitioning between several different groups (classes), which is then followed by compilation, on the basis of thematic maps. The classification procedure employs both very simple methods, based on the determination of the boundaries between classes by the user, and sophisticated algorithms inherent in contemporary mathematical and statistical methods, such as cluster analysis, fuzzy-classification, artificial neural networks, etc. In IDRISI, a large number of modules are provided that make it possible to perform both a supervised and unsupervised classification. Our experience indicates that, when tackling environmental protection problems, the most efficient modules are the PCA (principal components analysis) and Isoclust, in which there is an iterative algorithm of cluster analysis for unsupervised classification.
The accomplishment of a complex analysis of the results obtained, and prep- aration of information for decision-making support, are to a great extent determined by the problem to be solved. Any type of raster GIS is provided with a large number of modules intended for complex analysis of the results, viz. modules for decision- making support, time series analysis, etc. In addition, the facility for automatic vectorization or manual digitization of raster data is frequently embedded. This allows the export of information into vector GIS formats in order to continue the analysis using vector GIS, as has been described in the previous section.

Figure 8.13. Distribution of SST across the White Sea.
To illustrate the employment of IDRISI for remote sensing data analysis, we present the procedure of classification of a NOAA AVHRR image (ISS RAS provided the processed data) containing information about SST.
The initial image N3 7613S.TIF has been converted into IDRISI format. The obtained file, N3 7613S.IMG, has been masked with the help of the MASK.IMG file (1 - the White Sea, 0 - land) using the module IMAGE CALCULATOR of the GIS IDRISI according to the formula:
N3-7613SM.IMG = [N3-
7613S] [MASK] (8.1)
The result is the image displayed in Figure 8.13. Using profiles 1-3 shown in Figure 8.13, the signal variation has been examined. For instance, the revealed pattern of the signal variations along profile 1 is illustrated in Figure 8.14.
|
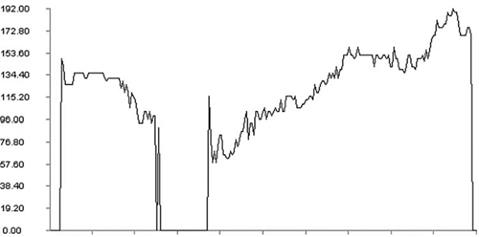
Figure 8.14. Signal variations along profile 1 of Figure 8.13.

Figure 8.15. A histogram retrieved from the image displayed in Figure 8.13.
The signal decline over one-third of the profile is due to the Solovetskiy Archi- pelago. The signal level increases across Onezhskiy Bay. In addition, a histogram retrieved for the image in Figure 8.13 was analyzed. This histogram (Figure 8.15) reveals a minor maximum with signal values of about 170 (17oC), then a main maximum with signal values of about 140, and one secondary maximum with
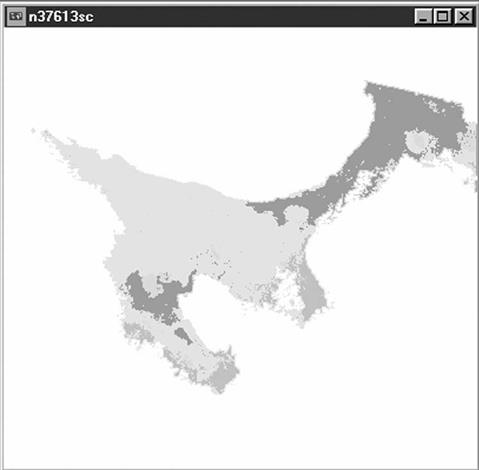
Figure 8.16. Results of classification of the image in Figure 8.13.
signal values of about 80. Comparing the histogram and signal variations inherent in the profile, one can delimit out three zones differing in SST:
• A cold zone with signal values below 95.
• An intermediate zone with the signal values between 95 and 155.
• A warm zone with the signal values above 155.
Proceeding from the above, with the help of the RECLASS module, one can perform a classification of the image presented in Figure 8.16.
Spaceborne data play an increasingly important role in studies of nature protec- tion. Analysis of these data, accomplished by means of a raster GIS, makes it
|
possible to reveal changes occurring in the state of the environment. That is why such studies are so important in providing information support for decision making.
8.6 INFORMATION SYSTEM FOR DECISION-MAKING SUPPORT
The developed information system is designed for decision-making support for a broad user community. The Internet is an optimal environment for such an informa- tion system (Kondratyev and Filatov, 1999; Kondratyev et al., 2000). The HTML, JavaScript, and Java languages are most suitable for the realization of a hierarchical model of multimedia data. If required, hypertext links can be made available together with an easy access to at least some data for the user. (This is how numerous servers have been realized for propagation of science information, in particular, that of the United States Environmental Protection Agency (EPA), http://www.epa.gov/ (Rastoskuyev, 2000)). The structural scheme of the informa- tion system placed on the Internet is presented in Figure 8.17 (Donchenko et al., 2002; Rastoskuyev, 2002).
The upper level of the system accommodates the attained general conclusions concerning the problems that can be described within the limits of the information collected. The extensive reviews placed there comprise the basic concepts and definitions and provide a simplified presentation of the social, economic, and
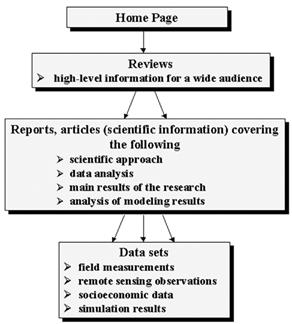
Figure 8.17. Structure of the information system intended for the Internet.
ecological problems inherent in the White Sea region. Thus, the upper level of the system serves as a means of decision-making support, as well as popularization of scientific knowledge and education in the mass media.
The middle level (articles, reports) is intended for the audience that is qualified and experienced enough to understand the appropriate descriptive and illustrative material, sometimes of specialized nature, that demonstrate the results obtained on the basis of the collected data. Finally, the lower level of the system contains diverse data that have been assembled for the White Sea Basin.
The WHITESEA Information System has a hierarchical structure (Figure 8.17), which means that the conclusions accommodated at the upper level are confirmed by the scientific findings placed at the middle level, which, in turn, can be proved and reaffirmed through reprocessing of the data stored at the preceding level. In addition, the system has a lot of hypertext links that allow the user to relate different areas of investigation, and to receive explanations, additional descriptions, or clarifications concerning the subject of interest.
An important stage of the system s development is the construction of a user- friendly interface. If the interface is user-friendly, the number of visitors will increase. A first priority is to achieve easy access to the desired information in order to facilitate its use by a less educated audience. There are three ways of getting access to the desired information: (1) with the help of hyperlinks, (2) via the menu placed in the left-hand frame of the web page, or (3) by making use of the search function. The functions supporting the keyword search system are written in Java- Script. Examples of the user interface are presented in Figure 8.18.
The list of keywords is compiled automatically with the help of a special program written in Visual Basic. The scheme of the program package is presented in Figure 8.19. In the first stage, the program forming the keyword list compiles a list of sub-directories where files are stored. In the next stage, a list of files with .HTML (.HTM) extensions is formed for each sub-directory. In each of the HTML files found, a list of key words is read, which is stored in the file header. On this basis, a general list is formed, which consists of pairs comprising a keyword and the file name. After that, the list is subdivided into components and is written in dynamic arrays containing keywords and file names. The keyword array is sorted, after which both arrays are re-written into a list of keywords placed in alphabetical order in accordance with the syntax rules of HTML. The list is automatically inserted into the
Search.htm file, which forms the basis of the information search.
In the information system, the data are placed into databases in Microsoft Access format. To facilitate access to the data via the Internet, the databases are converted into hierarchically assembled collections of tables accompanied by diagrams, as can be seen in Figure 8.20. Simultaneously, access to the databases is provided in the regime of copying.
Access to remote sensing data in the information system proceeds in three regimes: (1) the query regime (access to metadata); (2) the look-up (viewing) regime; and (3) the copying regime. The specific features of access to remote sensing data are illustrated in Figure 8.21.
The decision-making support facility is accomplished on the basis of scenarios.
|
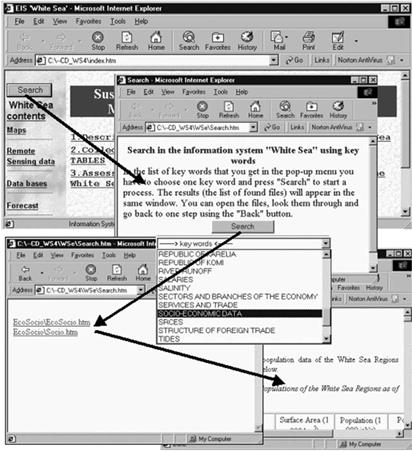
Figure 8.18. The White Sea search system using keywords.
The principal scheme of decision-making support, assured in the developed informa- tion system, is presented in Figure 8.22.
The results of mathematical modeling (which, as a rule, is performed on the basis of the solution of differential equations) are presented as algebraic equations or graphs. There, the forecast of the situation development is generated either by a substitution of certain parameters, influencing the final result, into the equations, or by choosing a scenario as a function of the input parameters. A simple example of the realization of this approach is shown in Figure 8.23 which presents the adopted scenarios of development of diatoms, flagellates, and zooplankton as a function of nitrogen and phosphorus input from river runoff. The scenarios have been developed at the Finnish Institute for Marine Research (FIMR). Similar scenarios have been developed for other processes taking place in the White Sea.
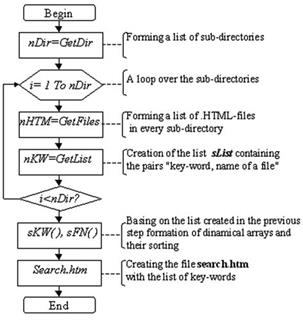
Figure 8.19. Operational scheme of the program used to compile the keyword lists.

Figure 8.20. Databases accommodated by the system.
|

Figure 8.21. Remote sensing data stored in the information system.
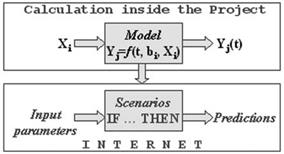
Figure 8.22. Decision-making support facility based on running the IF ... THEN scenarios.
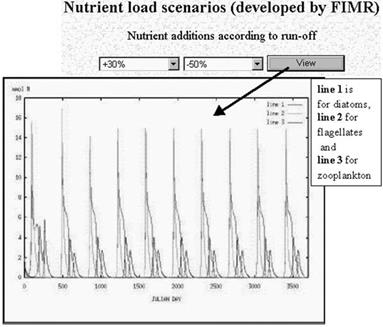
Figure 8.23. Scenarios considering the nutrient load in the White Sea (developed at FIMR, Helsinki).
8.7 CONCLUSIONS
The GIS for the White Sea region can be characterized by the following specific features:
• The concept of a data warehouse has been realized in the information system, with two levels of organization of the information collected, viz. the geo- database and the Internet.
• Analyses of the collected data are mainly accomplished in the system by means of ArcView 3.x, 8.3 and IDRISI GIS; the process of integrating the ecological monitored data into the data warehouse is automatic using specially developed program modules.
• The system is designed to be compatible with the standard browser user interface, with software intended for working on a client s site; this makes it possible to use the information system both on the Internet and on a local computer.
The specialized GIS developed here for the White Sea was used for the assess- ment of its current state and its possible changes under the influence of anthropo- genic forcing and natural climate variations. The assessment was accomplished on
Sec. 8.7]
|
Conclusions 327
the basis of both expert conclusions (Chapter 9) and numerical simulation results obtained for the White Sea (Chapter 10). This system can further be used by a range of scientists for solving practical problems related to the development of regional industries, agriculture in the catchment, as well as exploitation of natural resources inherent in the White Sea.
Date: 2016-03-03; view: 921
| <== previous page | | | next page ==> |
| Economy of the White Sea watershed area 7 page | | | Water quality assessment and the problem of marine ecosystem stability |