CATEGORIES:
BiologyChemistryConstructionCultureEcologyEconomyElectronicsFinanceGeographyHistoryInformaticsLawMathematicsMechanicsMedicineOtherPedagogyPhilosophyPhysicsPolicyPsychologySociologySportTourism
Economy of the White Sea watershed area 4 pageKomi Republic 428 328 225 240 225 215 201 177 179 147 102
Table 7.28. Change of the industrial production during 1990-2002. From Socio-economical Development ... (2003).
Change in the industrial production since the previous year (%)
Region 1990 1991 1992 1993 1994 1995 1996 1997 1998 1999 2000 2001 2002
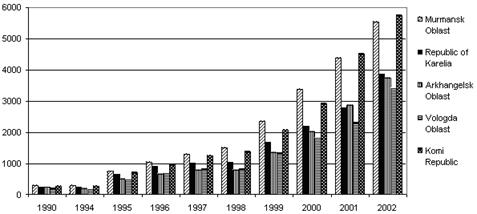
Figure 7.7. Agricultural production (in billions of rubles). From Socio-economical Development ... (2003).
Figure 7.8. Turnover of the retail trade (billions of rubles for the period 1990-1998, and millions of rubles during 1998-2002). From Socio-economical Development .. . (2003).
Government practiced a very tough financial policy, including payment delays to budget-supported sectors. High inflation rates resulted in a very pronounced economic stratification of the population. According to the official statistical data, over 20% of the population live
Figure 7.9. Per capita turnover of the retail trade (billions of rubles for the period 1990-1998, and millions of rubles during 1998-2002). From Socio-economical Development .. . (2003).
Figure 7.10. Volume of commercial services (billions of rubles for the period 1990-1998, and millions of rubles during 1998-2002). From Socio-ecoonomical Development ... (2003).
below the subsistence level (Figure 7.13 and Table 7.30). Those are primarily pen- sioners and employees of budget-supported sectors. The fraction of the poor has been greatest in the Arkhangelsk Oblast throughout the study period.
7.4 SECTORS AND BRANCHES OF THE ECONOMY
As stated above, the economy of the White Sea region relies predominantly on industrial production. Other sectors, including building construction, transport, and agriculture, are not so significant. The contribution of services, which have lately been developing quite actively, to the GRP is about 50%, but this is
Table 7.29. Mean monthly implicit wages (in thousand rubles per employee in the period 1990-1998, and in rubles during 1998-2002). From Socio-economical Development .. . (2003).
1990 1993 1994 1995 1996 1997 1998 1999 2000 2001 2002
Arkhangelsk Oblast 345 72 275 614 956 1,074 1,168 1,771 2,621 3,701 4,972 Regions producing with little impact on the White Sea catchment
obviously insufficient (Figure 7.14). These indices lag behind corresponding indices demonstrated by developed countries, the Nordic countries included. Industry in the White Sea region has initially been focused on producing raw materials and semi-finished products both for the other parts of Russia and for export. Forestry, mining, and metallurgical industries as well as energy production are the leading sectors of the economy in the region. The fishing industry still has some importance in coastal areas. Before 1991, investments were being made into the development of industrial enterprises, but they were often used inefficiently. Another serious problem asso- ciated with the development of the industrial sector was the almost complete neglect of environmental issues. This eventually resulted in severe ecological situations in many parts of the White Sea region. A list of the ten largest enterprises in the region
Figure 7.11. Mean monthly per capita money income (thousands of rubles for the period 1990-1998, and in rubles during 1998-2002). Socio-economical Development .. . (2003).
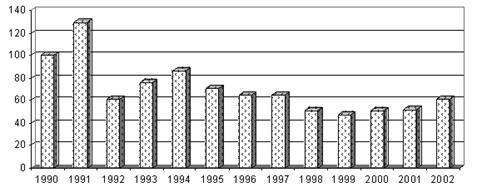
Figure 7.12. Dynamics of the mean per capita real disposable income in Karelia with 1990 taken as a benchmark (i.e., 100%)
Figure 7.13. Percentage of the population in the White Sea region that live below the subsistence level.
comprises four pulp-and-paper plants, four mining and two power producing enter- prises (Table 7.31). During the 1990s, the economic development of the White Sea region exhibited a tendency toward a sharp decline in industrial production, which was common for the entire Russian Federation at that time. It is only recently that some growth has been observed. The dominant branches of the regional industry are different in different admin- istrative units of the area. These are ferrous and non-ferrous metallurgy in the Murmansk Oblast, forestry industries and timber export in the Arkhangelsk Oblast and Republic of Karelia, ferrous metallurgy and forestry industries in the Vologda Oblast, and the fuel industry, including oil, natural gas, and coal produc- tion in the Komi Republic (all its major deposits, however, are situated outside the White Sea catchment).
Table 7.30. Population with income below the subsistence level (in %). From Socio-economical Development ... (2003).
Thousand persons Per cent of the total population
Figure 7.14. The GRP as partitioned between different sectors in 2001. From Socio-economical Development .. . (2003).
Table 7.31. Main features of the largest industrial enterprises in north-western Russia in 2002. From Rating of Industrial Enterprises ... (2003).
7.4.1 Arkhangelsk Oblast The Arkhangelsk oblast is Russia s largest producer of sawn timber and pulp. Two of Russia s largest enterprises in the forestry sector are situated there (Table 7.31). In this region operate daughter companies of Rosneft and Lukoil; a significant branch of which is engineering industry: the shipbuilding company Sevmash has 27,000 employees, which is far more than the personnel of other industrial enterprises in the White Sea region (www.dvinaland.ru\econo\otrasli.asp). Of high importance for the Arkhangelsk Oblast are military-related activities, including shipbuilding and maintenance, machine building, and metal processing. The oblast accommodates several naval bases and the Plesetsk cosmodrome. In the mid-1990s, the Arkhangelsk Oblast was in a very poor shape. The
military-related activities initiated by the federal government lacked state funding; rocket launches in the cosmodrome and nuclear tests in the Novaya Zemlya were terminated. As a consequence, many professionals became unemployed and overdues reached 17-19 months. Since the late 1990s (after the national currency devaluation), the situation has begun to change. Many military ships were converted into manufacturing trawlers, barges, drilling platforms; parts of rocket launches was moved from Baikonur to Plesetsk. Active geological reconnaissance surveys in the Novaya Zemlya resulted in many mineral deposit finds. The volumes of investments, notably foreign, started growing rapidly. The Rosshelf company is planning to extract up to 50 billion m3of gas in the Barents Sea, placing orders with machine building plants for construction of ice- resistant drilling platforms. In addition, the Sevmash and Zvezdochka enter- prises received military orders for renovation of vessels built earlier as well as for the disposal of ships, submarines, and rockets (Denisenko, 2002). The growth of industrial production peaked in 2000: the increase was 30%, and the total growth over 2000/2001 was more than 1.5-fold. Because of the drastic decline in the previous years, however, the industrial production per capita in the White Sea region is still very low. Exploitation of the Lomonosovskoye diamond deposit began (the mining volumes are still at a very low level), and commercial diamond mining will start in the near future. The reserves suffice for 50 years of operation of the Severoalmaz enterprise (the Alrosa daughter company), but approximately US$ 350 million have to be invested to reach the planned production level. Simultaneously, diamond- cutting facilities are being established in the oblast. The oblast contains 270 prospected deposits, including significant oil (1.2 billion tonnes) and gas (620 billion m3) reserves. Of crucial importance for the oblast is the development of the ground transport project called Belkomur . This is a network of roads connecting the Ural region and Scandinavia. Part of this road system has already been built. However, a few sections require completion. A very important sector for the oblast is small businesses. The oblast authorities created an efficient system for its support, and managed to organize a competition- based access to financial resources. The greatest volumes of sawn timber and pulp in Russia are produced in the Arkhangelsk Oblast (Tables 7.32-7.33). In addition, industrial enterprises of the oblast manufacture large amounts of other products, e.g., paper, cardboard, chipboard, fibreboard as well as processed items such as furniture and building construction components). The contribution of the regional forestry industry to ind- ustrial production output constituted 44.5% in 2002, and exceeded 50% in 1999 (www.dvinaland.ru\econo\otrasli.asp; www.dvinaland.ru\econo\lpk\lpkl.asp). The pulp-and-paper industry has the greatest share in the forestry sector. Two of the largest enterprises have gradually assimilated small-sized logging firms. About US$ 330 million were invested in the Arkhangelsk pulp-and-paper mill (the Titan group) during 1998-2002. In the past few years, the Ilim pulp group invested 640
Table 7.32. Timber harvesting volumes during 1992-1997. From Economic Geography ... (1999), and the data provided from the Institute of Economic Studies, KRC of RAS.
Timber harvesting volumes (million cubic meters)
1992 1993 1994 1995 1996 1997
Table 7.33. Volumes of forestry industry production (www.dvinaland.ru\econo\lpk\lpkl.asp).
Billion rubles Share (%)
Branch 1999 % of 1998 In industry sector In forestry sector
million rubles in the Kotlas pulp-and-paper mill, including 120 million rubles invested in environmental protection projects. Oil export does not dominate at this time, although it is only inferior to sawn timber and pulp. The export of timber products, including roundwood, has grown. Hydrocarbon deposits attract foreign investments, with volumes several times greater than those in Karelia and the Murmansk Oblast. The greatest foreign investments in the Russian oil industry were made by Conoco for the Ardalinskoye deposit, which now extracts 3.5 million tonnes of crude oil per year. The giant Lukoil company has invested 3.5 billion rubles into its daughter company in the Arkhangelsk Oblast, and is planning to extract 7 million tons of crude oil per year by 2005 (Denisenko, 2003). A significant part of forestry products are exported. The revenues account for about 75% of the total regional income from exports (Tables 7.34, 7.35). Regarding some specific products, over two-thirds of them are exported.
Table 7.34. Structure of the regional export (www.dvinaland.ru\econo\otrasli.asp).
Total 631.8 100 622.4 100 98.5
The second significant sector, lagging far behind the forestry industry, is the fuel industry: it constitutes 21.2%. It is followed by machine building (13.5%), electric power production (9.7%), and the food industry (7.6%). The latter is predominantly represented by fisheries and fish processing. All oil and gas deposits are located outside the White Sea catchment, but these fuel and energy resources constitute the basis for further development of the economy of the Archangelsk Oblast. It is worth mentioning that machine building has been developing successfully, and its share in industrial production has signifi- cantly increased since 1999. A drastic, 17-fold decline which occurred during the period of economic reforms in Russia is associated with the production of walling materials (e.g., chipboard production ceased). At the same time, manufacturing of plywood and cardboard has actually increased.
7.4.2 Murmansk Oblast For the industry of the Murmansk Oblast, the 1990s were characterized mainly by a substantial decrease in the physical volume of production. However, the decrease rate was less dramatic on average than in Russia. As a result, the total reduction in the regional industrial output over the 1991-2000 period constituted 28% in the Murmansk Oblast, whereas for all of Russia it was as high as 46%. The last year demonstrates a new tendency in the recovery of industrial production both in the Murmansk Oblast and in Russia as a whole (http://www.hkki.fi/-vbi/murnam_ru.pdf [in Russian]; Murmansk Oblast .. ., 2001). The above-mentioned data on the structural change in the region s economy, namely in industry, allows the following conclusions to be reached regarding the relevant innovations. First, it is the predominance of industries oriented toward the national and world market (i.e., export-oriented industries). Second, both the pro- duction and employment shares of industries that serve the local (intra-regional)
Table 7.35. Export of forestry products from the Arkhangelsk oblast during 1997-1999 (www.dvinaland.ru\econo\lpk\lpkl.asp).
1997 1998 1999
Including Including Including export export export
Plywood T.m3 24.8 - - - 32.5 22.1 68 135 47.1 20.1 42.7 91.0
market are relatively small: machine building (represented in the region mainly by ship maintenance plants), light industry, agriculture and some others. Third, during the 1990s the share of export-oriented industries in the production volume has grown at the expense of the ones focusing on local consumers. Thus, the first consequence of the establishing market economy is the steadily developing openness of the region s economy. One of the important characteristics of economic processes is the dynamics of investment demand. Almost all through the 1990s, Russia had been surviving in conditions of deep investment crisis. Until 1999, the average rate of a real investment decrease in the Murmansk Oblast was even higher than in Russia as a whole. As a result, the volume of the investments expressed in relative prices in 1998 was only 16.8% of the 1991 level (i.e., an almost six-fold reduction). The year 1999 was the best for investment activities in the Murmansk Oblast, when the volume of capital investments almost doubled compared with the previous year (189%). However this same index for 2000 was only 101%. Date: 2016-03-03; view: 643
|


 Share In % of Share In % of Share In % of Exported items Production Volumes (%) 1996 Production Volumes (%) 1997 Production Volumes (%) 1998