CATEGORIES:
BiologyChemistryConstructionCultureEcologyEconomyElectronicsFinanceGeographyHistoryInformaticsLawMathematicsMechanicsMedicineOtherPedagogyPhilosophyPhysicsPolicyPsychologySociologySportTourism
White Sea watershed hydrology and anthropogenic impact 1 page
River runoff (encompassing fluxes of water per se, heat, detritus, and dissolved organic and inorganic matter) in conjunction with anthropogenic factors determines and directly affects not only the river beds, but also the river estuaries and eventually the recipient water body - the White Sea in this case. Moreover, river runoff is the main surface water resource, which determines many aspects of both human life and economic activity. Quantitative characteristics of the river runoff submitted to the influence of climate change and anthropogenic impacts are mandatory for obtaining not only reliable evaluations of potential changes in the environment, ground-based, freshwater, estuarine and marine ecosystems, but also for an integrated estimation of cumulative changes in the region. The direction of such changes determine to a great extent the water supply for the population, functioning of water-retaining industries, water transport, energy production, agriculture, and the fishing industry. This chapter provides a quantitative characterization of rivers in the White Sea watershed and the anthropogenic influences upon the rivers and their estuaries. Section 2.1 describes the main hydrological features and anthropogenic influence on the White Sea watershed. The elements of the water balance and water resources are taken up in Section 2.2. Section 2.3 discusses aspects of the variability in hydrological and chemical regimes of river systems. The main features of pollutant transport via river runoff are detailed in Section 2.4. Section 2.5 discusses the anthropogenic impacts on the estuaries into which the rivers feed.
2.1 HYDROLOGICAL FEATURES AND ANTHROPOGENIC INFLUENCE ON THE CATCHMENT
The catchment of the White Sea basin comprises the lower part of the hydrologic network of the rivers flowing in the Murmansk and Archangelsk regions, and the
Republic of Karelia. The total area of the White Sea catchment amounts to 1,100,000 km2, about 92% of which may qualify as a hydrologically adequately studied zone (see Table 2.1). The ratio of the catchment surface to the marine area of the White Sea is 8.25 : 1, which is the greatest among all peripheral seas of the Arctic Ocean. The proportion is an indirect indicator of the effect of river runoff upon these peripheral seas (Ivanov, 1976). Known for its well-developed river network, abundant lakes, and swamps, the catchment of the White Sea is situated within a zone of excessive moisture due to very high levels of atmospheric precipitation and low levels of evaporation. The rivers in the region are fed mostly from meltwater. However, because of slow snowmelt in the taiga zone, the spring flood lasts longer than usual. Large-plain watercourses carry a great amount of suspended particles during the spring flood. This is the result of both erosion processes in the river watershed areas and intensive abrasion of riverbanks and beds. Importantly, many tributaries (such as those originating from of the Onega and Mezen Rivers) also retain high current speeds (up to 1 m s-1) (State Water Cadastre, 1992). Over the major part of the catchment, similar geological and geomorphological conditions of development of the hydrologic network and river bed processes are observed. These are mainly areas where free and limited conditions alternate. Free conditions of the development of river bed reformations are observed within the range of seaside lowlands and in individual regions of the coastal areas of the White Sea. The conditions of limited development of river bed reformations can be found in Karelia and the Kola Peninsula, where there are hard rocks resistant to erosion, numerous rapids, and steep shores and river banks. Such an aquatic regime and geomorphological conditions predetermine for most rivers in the region the nature of the river bed processes, and consequently a diversity of river bed types. The number of incised and wide-valley river beds is practically the same. The most widespread types of river beds are scrolls and branching. Besides, in the Severnaya Dvina basin, karst phenomena in chalkstone and gypsum create underground water bodies and numerous springs (Gladkov, 1994; Grishanin, 1997). The basic features of the ice-thermal regime of the rivers within the basin are mainly controlled by climatic conditions. In addition, the formation and variability of the ice-thermal regime is influenced by the water content, local area altitude, speed and direction of currents, and the presence of karst. These factors account for differences in the ice-thermal regime of neighboring rivers and also between separate parts of the same river. The transition of water temperature over 0.2oC in spring occurs, as a rule, in the third 10 days of April in southern regions, and in the second 10 days of May in the northern ones. The highest monthly mean water temperature (July) is over 18oC in the southern areas, and less than 15oC in the northern and eastern parts of the catchment basin. The river water temperature transition over 0.2oC takes place prior to 20 October in the north-east, and in the first 10 days of November in the south. The spring ice floating begins in the southern part of the basin during the third 10 days of April and it gradually moves to lower reaches of the rivers by the third 10 days of May. These diverse and complex hydrological and geomorphological conditions
strongly affect the formation of the specific natural hydrochemical regime of the rivers in this region. River water here mostly belongs to the hydrocarbon-calcium type. Since the water supply to rivers and lakes from underground sources is insig- nificant, a decisive role in the formation of surface water hydrochemical properties belongs to the soils and their underlying layers. The rivers running through taiga and swamp areas are strongly colored due to high concentrations of humic substances (Resources .. ., 1972). The river system of the White Sea catchment is within the so-called Northern Economic Region, which is characterized by densely-located industrial enterprises (Figure 2.1). Industry in the region is mainly constituted by non-ferrous metallurgy works integrated by the Norilsk Nickel concern and located in the area neighboring the towns of Pechenga-Nickel and Monchegorsk (Evseyev and Krasovskaya, 1996; Ivanov, 1998; Surveys of Pollution .. ., 1991, 2000). A large aluminum industrial complex is in operation in the town of Kandalaksha, while there are iron ore mining complexes in the towns of Olenegorsk and Kovdora. Numerous machine manufacturing and construction plants and food processing factories are concentrated in the cities of Murmansk, Severodvinsk, and Olenegorsk. Large pulp-and-paper and timber enterprises are situated in Archangelsk, Novodvinsk, and Koriazhma. Energy production in the region is carried out by the Kola Nuclear Power Plant, a number of hydroelectric power stations (HEPS) on the Niva and Tuloma Rivers, and thermal-electric power stations (TEPS) in the cities of Archangelsk, Kirovsk, and Severodvinsk; all consume coal and black oil. Such an intensive industrial development of the territory resulted in the formation of impact zones and endangered/ hot spot areas due to the following factors (Evseyev and Krasovskaya, 1996):
• Mechanical disturbance of soils, mainly in the crinoline zone, as well as strong pollution of underground and surface waters and air contamination, caused by dumping of such environment-endangering substances as coal sludge, strontium compounds, heavy metals (especially mercury), and oil products in the regions of mining industries. • High levels of pollution of natural waters by treated and non-treated industrial wastes containing phenols, formaldehyde, furfural, lignosulphonates, and heavy metals (copper, zinc, lead, and mercury). • Contamination of the air basin due to industrial emissions of such chemicals as hydrogen sulfide, carbon disulfide, and soot. • Mechanical disturbance of vegetation cover and soils, decrease of biodiversity over vast territories occupied by pulp-and-paper and timber production factories. • Atmospheric contamination with nitrogen compounds, benzapilene and carbon oxide caused by propulsion, as well as considerable mechanical disturbance of soils, especially in the permafrost regions. • Discharge of non-purified or inadequately purified sewage water from the food industry (including fish processing), which contains organic matter, nitrogen compounds, suspended particles, etc.
Table 2.1. River catchments in the White Sea region belonging to various administrative units within the Russian Federation.
2. Catchments of the rivers within the Republic of Karelia
Figure 2.1. Location of industrial activities within the catchment of the White Sea.
• Pollution of the environment with sulphur and nitrogen oxides, heavy metals, and soot caused by large TEPS using solid fuel.
Thermal pollution of water objects is dangerous for the Northern Economic Region as nuclear power plants not only cause thermal contamination but are potentially dangerous in terms of generating areas with a high probability of anthro- pogenic contamination.
Housing and public/communal services of cities, towns, and little settlements contribute everywhere to the generation of hot spots due to an inefficiency, and limited facilities, of sewage treatment plants. Communal sewage is bacterially con- taminated; it contains organic compounds, suspended matter, oil products, surface- active substances (SAS), etc. These municipal services contaminate the natural environment with solid-waste products because of an inadequately developed recycling technology in Russia. As a result, vast areas become disordered, the surface drainage becomes polluted, and numerous fires occur. River runoff in the region carries abundant chemical substances, which even- tually turn river estuaries and coastal zones of the White Sea into potential sources of pollution (Table 2.2). In recent years, numerous aspects of land-based anthropogenic forcing upon marine ecosystems have been revealed. The special features of this impact are the increased level of chemical contamination in coastal waters and propagation into the sea of plumes of pollution composed of stable chemicals present in low concentra- tions (low-intensity factors).
Table 2.2. Amount of pollutants brought into the White Sea annually (Surveys of Pollution .. ., 1991, 2000). The numerator shows the total amount of incoming matter; the denominator stands for the amount of pollutants incoming with river runoff and fresh discharge.
Amount of pollutants (thousand tons per year)
Numerator: the entire volume of incoming substances. Denominator: the river runoff respective share.
Because of the increasing anthropogenic impact and resultant negative conse- quences, a gradual, appreciable degradation of estuary ecosystems takes place along the coastlines of the White Sea. Along with the income of pollutants to the catchment, and direct pollution of surface water bodies, the river regimes are strongly influenced by various civil engineering and water transport activities intended to improve the local navigation conditions (first of all, bottom deepening), including sand and gravel extraction from river beds, and timber rafting. These technogenic alterations impose a long-term impact not solely upon the water flow and river bed, but also the state of river ecosystems as a whole. Another serious concern is additionally associated with the ever-increasing accumulation of toxic pollutants in fish and other sea biota, as well as bacterial pollution of coastal seawater.
2.2 WATER BALANCE ELEMENTS AND WATER RESOURCES
One of the significant consequences of climate change can be a change in the characteristics of the water balance elements and water resources of the region, and hence, a change in the hydrological regime and state of freshwater and the estuary ecosystems. The results of studies of river water discharge into the White Sea, and the interannual and long-term seasonal variability in the total river water inflow to the sea, as well as runoff fluxes from some individual rivers are illustrated in Figures 2.2-2.4. It should be noted that the runoff of the following seven large rivers: Severnaya Dvina, Onega, Mezen, Panoy, Niva, Kovda and Kem amounts to 78% of the total inflow of continental water into the White Sea (Table 2.3). Therefore, based on the data relevant to temporal variations in the runoff of these seven rivers, it is possible to assess the integrated impact of changes upon river runoff in the White Sea watershed on the whole. The seasonal runoff temporal variations are not uniform. During the ice-free period (from May to October) four large rivers bring about 80% of the annual runoff to the sea, and during the spring tide (May-June) their con- tribution constitutes about 50%. A combined analysis of long-term variations of meteorological and hydrological characteristics has revealed that in recent decades, along with anthropogenic pollution of river waters, the rivers under consideration have become more high- flowing. During the study period, the annual average air temperature increased; the wintertime mean temperature increased by 0.8oC, and the mean annual and winter- time precipitation increased by 8% and 15%, respectively (Ivanov et al., 1996). In order to reveal the causal mechanisms of contemporary changes in the hydro- logic regime of rivers and to analyze in detail the distinguishing features of the inherent hydrological processes, a set of data from seven water balance stations (WBS) have been used (located in the forest, forest-steppe, and steppe regions of the European part of the former USSR, and effecting a long-term monitoring of all water balance elements between the late 1940s to early 1950s). The investigations
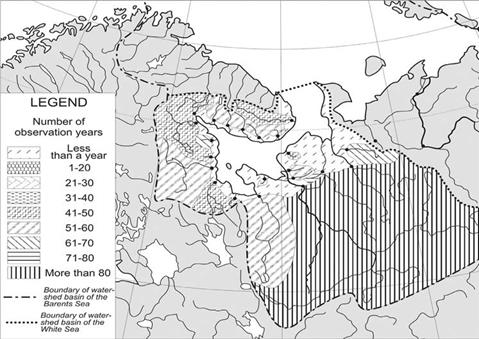
Figure 2.2. Location of the study areas and duration of observations of river runoff within the White Sea catchment.
performed on the water cycle processes from the WBS data have resulted in the following conclusions:
• The data from all WBS for the most recent 10-15 years reveal a considerable increase of annual atmospheric precipitation (50-120 mm), with the most sig- nificant growth falling in the spring-summer period; • The precipitation increase occurs against the background of temperature growth during the cold period, and its decrease in the summer season. • As a consequence of this increased wetness, the soil water content in the first 1-m layer increased by 10-30 mm. • Owing to this situation, favorable conditions arose for infiltrative feeding of underground waters. The levels of basic aquifers became 50-100 cm higher. • The increased volume of underground waters resulted in enhancement of sub- terranean feeding of rivers and dry-weather drainage (Georgievsky et al., 1995).
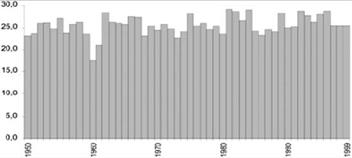
It should be mentioned that the positive constituent of the freshwater balance of the White Sea is determined not only by the inflow of continental waters, but also by atmospheric precipitation over the marine area. The long-term interannual and seasonal variations of river runoff and precipitation income are illustrated in
(a)
(b) (c)
(d) Figure 2.3. Long-term variability in the river water runoff (km3) into the White Sea. (a) Arkhangelsk Oblast; (b) Republic of Komi; (c) Murmansk Oblast; (d) White Sea as a whole.
Figure 2.4. Seasonal variations of river runoff (%) into the White Sea from inflowing rivers: (a) Varzouga, (b) Niva, (c) Kem, (d) Onega, (e) Severnaya Dvina, (f) Mezen, (g) White Sea as a whole. Figure 2.5. As seen, in the White Sea the inflow of river waters exceeds the amount of atmospheric precipitation (Ivanov et al., 1996). Thus, for the White Sea catchment, the increase in river runoff and water level in lakes distinctly stands out against the background of respective long-term mean
Table 2.3. River discharge into the White Sea.
Date: 2016-03-03; view: 524
|

 Data from the lowest hydrometric river station