CATEGORIES:
BiologyChemistryConstructionCultureEcologyEconomyElectronicsFinanceGeographyHistoryInformaticsLawMathematicsMechanicsMedicineOtherPedagogyPhilosophyPhysicsPolicyPsychologySociologySportTourism
Regional and Local IssuesOther environmental problems exist on a more-regional, societal level. These include problems of acid rain, where pollution byproducts in one region can cause acid rain in another region. Air pollution and smog also are regional problems. Water pollution, either in the ground water, river, bay, or ocean, is also a regional problem, often caused by herbicides and pesticides, in addition to suburban and urban street water run-off. Acid rain is a regional pollution problem caused by excessive fossil fuel air emissions for a regional area. http://news.discovery.com/earth/videos/earth-acid-rain-eating-washington-dc.htm Air pollution is a similar problem caused by excessive fossil fuel emissions for a regional area. https://www.youtube.com/watch?v=JSyc72cE32Q Other contaminants can enter the environment through water flow streams and landfills as water pollution. Herbicides and pesticides are typical problem compounds whose amounts introduced to a regional area must be controlled. https://www.youtube.com/watch?v=t8zUZHJDK-w
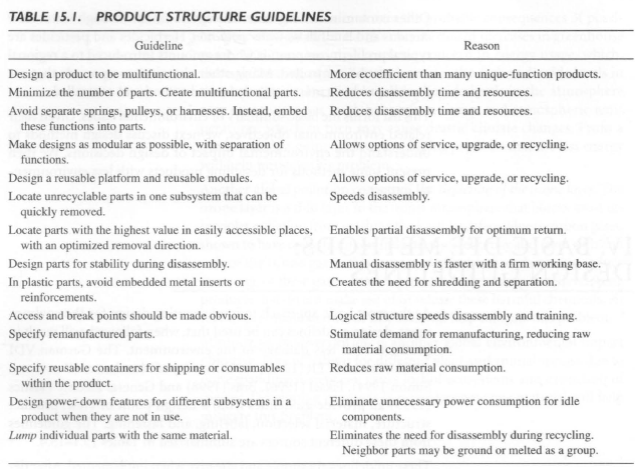
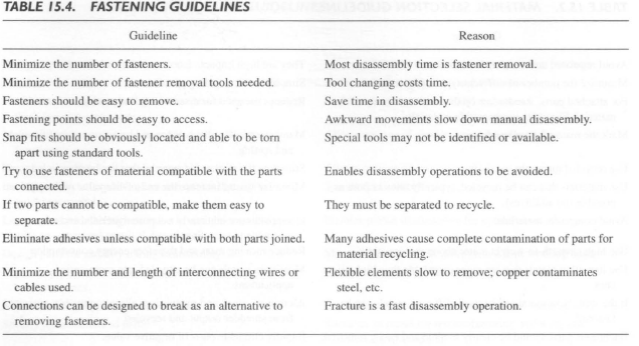
IV. BASIC DFE METHODS: DESIGN GUIDELINES As the most basic approach to implementing design for the environment, design guidelines can be used that, when followed, will result in products with less damage to the environment. The German VDI, British ICER, the University of Manchester (Dowie and Simon), Fiksel, Bras and General Electric Plastics all provide guidelines from a design point of view: product structure, material selection, labeling, and fastening. The guidelines from these different sources are summarized in Tables 15.1-15.4.
Application: Paper Carrier Design Consider the design of an electronic desktop organizer (Miller and Wood 1996; Miller 1995). This product is based on the conceptual design of an actual product in the market, a kitchen assistant. The purpose of this device is to store and retrieve electronic recipes. It is also intended to create a shopping list from selected recipes, producing a hardcopy printout of the list. The organizer uses a thermal printer similar to those found on many adding machines. Manufacturers sell the printer paper in rolls, and the organizer must safely store this paper. Schematics of the organizer's general layout and physical form are shown in Figure 15.3.
Given this product description, we now apply design-for-the-environment guidelines to the desktop organizer. For the purposes of illustration, only one guideline is considered here: minimization of material mass and type (Table 15.2). We will also only apply this principle to one subsystem of the product. To apply this guideline, let's first study the product's intended functionality. A portion of the function tree (Chapter 5) for the electronic organizer is shown in Figure 15.4. The highlighted functions, denoted by bold borders, are those functions performed by the paper carrier components, the focus of the study. Notice that some of the highlighted functions are secondary in nature; that is, they contribute less perceivable quality to the user than the primary functions for printing and ergonomic interface. For instance, the "hide components" function originates from the customer need for aesthetics. The "affix to back housing" (or enable degree of freedom [DOF]) function results from the architecture solution choice that utilizes a separate paper carrier for printing The original paper carrier design is shown in Figure 15.5(a). A removable aesthetic and protective cover encompasses the paper carrier. The paper is then intended to drop into the carrier well, where it is fed into the printer. Figure 15.5(a) shows the organizer's geometric features given the printing functions listed in Figure 15.4. For this example, again the metric chosen is the mass of the injection molded plastic paper carrier, a subsystem of the organizer's housing. Mass is a controllable design parameter in the injection molding process, as with many other manufacturing processes. As the mass of the paper carrier decreases, the energy of production will be reduced. Likewise, the quantity of virgin resin/oil resources is likely to decrease. https://www.youtube.com/watch?v=I3tfQeIzofE
Using this perspective, we seek to reduce the mass of the original carrier design, shown in Figure l5.5(a). Structural, spatial, paper-handling, and aesthetic requirements do not allow us to remove the carrier completely. It would thus be desirable to generate alternative form solutions to the carrier. As part of this synthesis process, analogous products may be considered to provide new form ideas. In this case, let's consider the analogy of packaging tape dispensers, a product that handles and feeds rolls of material (similar to paper rolls). A survey of tape dispensers shows that they utilize much less housing material for the same primary functions of the organizer's paper carrier. A new carrier design, based on tape dispenser configurations, is thus developed for the desktop organizer. Figure 15.5 (b) illustrates this new concept.
Comparing the carrier designs, the original design is approximately 120 gm of material. This mass further decomposes into three sets. The first is the mass of all the features that contribute to the set of functions: store paper, relinquish paper, accept new paper, and release used paper. The second and third allocations are for other function sets (protect paper, shed liquid contaminants) and the set of all secondary functions for the paper carrier. The mass or environmental cost of a function should be indicative of the importance of that function. The mass allocation for tape dispensers applies primarily to the first set of functions. The new carrier design thus realizes a mass reduction of approximately 10 gm to a new mass of 110 gm, using the volume from a solid model and the density of a polycarbonate/acrylonitrile-butadiene-styrene (PC/ABS) blend. In the new design, the dispenser can rotate backward for access to the paper. Changes to the paper carrier design have not formed any new primary functions. A new secondary function of forming an axis of rotation or pivot for the paper dowels is created. This function conveniently substitutes into the third set of paper carrier functions, replacing the secure paper cover function, which is no longer necessary. Estimating, conservatively, a production quantity of 50,000 units, the projected mass savings is 500 kg of injection-molded plastic material. Given that many devices implement similar functions of the paper carrier, these savings are very significant in terms of a design-for-the environment metric.
https://www.youtube.com/watch?v=A2bYPFKlKeo https://www.youtube.com/watch?v=A2bYPFKlKeo www.youtube.com/watch?v=A2bYPFKlKeo https://www.youtube.com/watch?v=A2bYPFKlKeo Extensions: Preview to Value Analysis for DFE While the application of material DFE guidelines might appear to be justified, it is difficult to measure the actual benefit to the customer, the environment, or the company. One might argue for a means to quantify the contributions of the guidelines. One approach is to consider costs to discriminate the perceived benefits using the project economic assessment approach of Chapters 3 and 14. Assuming a production quantity of 50,000 units, and using activity based power generation models (Miller 1995), it is possible to estimate the monetized environmental cost of air emissions avoided by the paper carrier design change. These costs are estimated using the material intensities provided by the IJM Handbook. Figure 15.6 contains these estimates. The emissions have been amortized over the expected life cycle of the desktop organizer product. The monetized costs of the relative simple improvements to the paper carrier result in savings of roughly $50 using either of two different models available, the Fristche or Pace monetizations. The data in Figure 15.6 provides a cost and benefits in terms of dollars. Yet the question remains: Is this a significant environmental cost savings? A complete life cycle assessment (discussed below) would answer this question. In this section, however, we choose not to analyze the issue at a very detailed level. Yet, designers still need a ruler by which to gauge their achievements. One approach is to compare the dollar costs and benefits to known environmental impacts that a design team can interpret. For example, Figure 15.7 displays a graph of estimated environmental emissions costs for product housings, all for completely different products (Miller). Looking at this chart can help a design team understand their housing relative to other housings. In this case, the functions of housings are similar across the products.
http://www.youtube.com/watch?v=UcWpkWBX04E Comparing Figure 15.6 with Figure 15.7, the design team notes that the environmental impact from the mass of the paper carrier is more than the impact of a VCR bezel and close to the impact of a predominantly plastic Braun shaver housing. Considering the more-detailed functionality required of a electric shaver housing, the design team might conclude that the new paper carrier design is a wonderful step forward, but further refinements are possible to be equitably comparable with a shaver housing. Such an approach can be used for products of similar complexity levels. Complex systems may be decomposed into subsystems to reduce the complexity of the system being measured by the environmental quality ruler.
The quality ruler presented in the previous section provides a basic method of assessing the environmental impact of a product and its components. It also generates a rough estimate for assessing possible product improvements. To develop a more complete analysis, a full life cycle assessment of a product is needed. This analysis is the topic of this section. https://www.youtube.com/watch?v=KrJUpSiCOoU Overview The SETAC Approach To design a product for the environment, an assessment of environmental impact must be completed. The Society of Toxicology and Chemistry (SETAC) has developed a four-step process for completing a Life Cycle Assessment (LCA). This process allows us to understand the environmental impact of a product, from manufacture through use through disposal. This process include the following steps: • Goal Definition: What is the purpose of the environmental analysis? A company may wish to reduce CO2 emissions, meet certification, reduce energy use, reduce component toxicity, and so forth. The goal should be defined and revisited. • Inventory: Having defined the goal, the scope of the product system should be defined. How much of the manufacturing process will be considered, all the way back to energy consumed and pollution generated when removing raw materials? For what expected customer use patterns should the typical energy utilization pattern be analyzed? Does there exist many possible alternative utilization patterns? What disposal routes should be considered? Should recycling be assumed? • Impact Assessment: Having scoped the system for study, an impact assessment of each step in the system can be made. We present two methods below. • Interpretation: The assessment must be interpreted for areas of high-leverage impact reduction and for comparisons against other alternatives. We now review each of these steps in greater detail. https://www.youtube.com/watch?v=x-XRF_hR-n0 Goal Definition The obvious first step in considering environmental assessment in product design is to establish clear objectives. Reducing energy usage is different from reducing toxic material content or redesigning a product for disassembly. What are the objectives? Some common objectives include meeting eco-labeling requirements, meeting regulations, or working to meet standards certification. Within these objectives, clearly defined engineering specifications (metrics), such as minimum mass and lumped materials, are established to evaluate a product. Overall product function: Once a goal is defined, the next step for a design team is to establish the boundary of the system to analyze. Typically, this task includes all activities and operations in the product life cycle. Having defined this boundary, one important item in the system definition is the overall product function, often called the system function in the LeA literature. The overall product function, as defined in Chapters 4 and 5, is the intended purpose of the product under environmental analysis. What is the purpose of the product? This function is important to state clearly and definitely, as it then permits environmental impact comparisons with other alternative technologies for the same function. For example, comparing the environmental impact of coffee grinders with telephones is not particularly insightful; they have completely different purposes. It can make sense to compare similar function subsystems such as the housings of a coffee grinder with the housing of a telephone, such as we did with different housings in the previous section (Figure 15.7). But basically one should compare similarly functioning systems. To environmentally compare the effects of a coffee grinder, it makes sense to compare the environmental impact of different technologies that convert coffee beans to coffee. For example, home electric choppers, home electric grinders, home hand-powered grinders, and prepackaged ground coffee are all reasonably equivalent alternatives that one could compare in environmental impact studies, since they all perform the same function: provide ground coffee from beans. The functional unit: With the overall product function defined, the design team must then establish a functional unit. This concept is the basic unit of output representing the product function. A functional unit for a coffee grinder might be one day's worth of ground coffee, or one cup of grounds. A functional unit for an automobile might be a mile of travel or a gallon of gasoline. A functional unit for a lawnmower might be the size of an average lawn in square meters, square yards, or acres. Emissions and environmental impact are calculated on a perfunctional- unit basis to compare alternatives. To understand whether chopping beans at home or buying preground coffee has more or less environmental impact, one must compare these alternatives on a per cup of-ground-coffee basis. In summary, the outcomes of the goal definition activity include an objective for the assessment, a system to examine, and a clear overall product function statement, complete with a functional unit.
Environmental Impact Inventory https://www.youtube.com/watch?v=WdOOmdFnTBI After establishing the system boundary and functional unit, the system itself needs to be described as a sequence of activities, each called a life cycle stage. Each life cycle stage takes in materials and energy and produces the desired activity outcome along with waste material and energy. We represent this process using material and energy flows, as presented in Chapter 5 when considering functional analysis. The basic life cycle stage is shown in Figure 15.8, where the inputs and outputs of concern are material and energy flows. http://www.youtube.com/watch?v=d-ZOOhsfZ-I In a generic product life cycle stream, each stage can be connected to others in complex ways, as shown for a typical analysis in Figure 15.9 If materials are recycled, or if components are returned to the manufacturer for reuse (remanufacturing), or if the product can be used for many cycles by the customer directly, these connections lead to different impacts on the environment. Understanding the quantity on each flow path of the material and energy is the data collection analysis portion of a life cycle assessment.
ImpactAssessment Having mapped the system and identified the flows in and out of each life cycle stage, the next step is to quantify these flows in terms of environmental impact. This step represents the assessment activity. We present two basic methods below for carrying out this analysis. Assessment methods: The basic method, AT&T's Environmentally Responsible Product Assessment Method, does not complete a numerical LCA. Rather, estimates of environmental impact are applied. Other similar methods include Motorola's Product Lifecycle Matrix (Hoffman, 1995) or the Environmental Impact Factors Analysis (ElF A) Method from Stanford University (Ishii and Lee). With the second more-advanced method, The Weighted Sum Method from Pre Associates (Goedkoop et ai,), we assign numerical impact weightings against the materials we use and the process we use. Here, though, the weightings used are average numbers for a region, not specific values for a particular production line at a particular factory. A completely accurate LCA assessment would calculate weightings based on measurements of the actual production equipment used. Such an assessment would consider the actual recycling, energy efficiency of plants, and so forth that the product in question utilizes. We will only briefly highlight such analysis.
Interpretation After an assessment is completed, the results can be interrogated for opportunities to change the design to improve the environmental objective and to compare amongst alternatives. Design choices that have a high impact on the environment can then be explored and refined. We now present two methods for completing the environmental assessment: a basic matrix approach based on qualitative ratings and a more advanced approach of quantitatively assessing impact.
Basic Method-AT &T's Environmentally Responsible Product Assessment http://www.youtube.com/watch?v=Tq2uk40r9SI Graedel and others at AT&T have developed a basic guideline and matrix approach to life cycle assessment (Graedel and Allenby 1995). Here, the product life cycle is broken down into five stages: resource extraction, product manufacture, product packaging and transport, product use, and refurbishment/recycling disposal. For each of these five stages, five environmental criteria are ranked, thereby resulting in 25 environmental metrics for the product.
The 25 criteria are evaluated and presented in matrix form, as shown in Table 15.5. Each matrix entry is filled with a ranking from 0 to 4, where 0 is a high-impact negative evaluation, and a 4 is low-impact positive evaluation. To complete each rating, guidelines for the matrix elements must be consulted, as shown in Table 15.6. After completing each of the 25 ratings, an overall rating is determined by combining the scores. The product is rated as:
where REPRT is called the Environmentally Responsible Product Rating, and Mij is the matrix element (i,j), Note the maximum REPRT rating is 100. While the overall rating is important, the real use of the method is in the breakdown of the scores, to indicate where the product DFE activity should focus. An effective visualization tool associated with the matrix is to polar plot each of the 25 scores. This plot provides a visual breakdown of where the product might be improved.
Example: Krups Coffee Mill http://www.youtube.com/watch?v=94NfA9qBPWI As an example, we will again consider the Krups Coffee Mill shown in Figure 15.10. The first step is to complete the matrix by filling in the elements, based on an analysis of the product. Utilizing the guidelines from Table 15.6, the matrix is filled as in Table 15.7. The matrix requires careful thought and analysis to complete, as the answers to the guideline questions are not always clear. For example, an understanding of the environmental impacts of various materials is necessary to understand if a particular material is in fact the least impact alternative. The analysis requires the designer to make a number of value judgments regarding the different impact of materials or processes that, to be objective, must be substantiated by actual research.
The energy use during the resource extraction phase is a good example of one such decision. Natural copper is more difficult to refine than iron, because it is found in lower concentrations, so the assumption is made that copper requires more energy during the resource extraction phase. Although this assumption may be valid, it is unsubstantiated until analysis of the coffee production operations are understood
Date: 2016-03-03; view: 1164
|


 V. LIFE CYCLE ASSESSMENT


