CATEGORIES:
BiologyChemistryConstructionCultureEcologyEconomyElectronicsFinanceGeographyHistoryInformaticsLawMathematicsMechanicsMedicineOtherPedagogyPhilosophyPhysicsPolicyPsychologySociologySportTourism
Specialty programsMake your own greeting cards, calendars, or labels. Major players in the desktop publishing game include Microsoft Publisher, Corel Ventura, QuarkXpress, and several Adobe products - PageMaker, FrameMaker, InDesign.
Features/Terms:
Applications: Spreadsheet A spreadsheet is the application of choice for most documents that organize numbers, like budgets, financial statements, grade sheets, and sales records. A spreadsheet can perform simple and very complex calculations on the numbers you enter in rows and columns. Examples of spreadsheet programs: MS Excel, Lotus 1-2-3, Quattro Pro, and Open Office Calc.
Features/Terms:
Do It! Excel Would you like to see a spreadsheet at work? You can open an actual spreadsheet by clicking one of the icons in the first row below. The file will download and open in whatever software you have that can open an Excel spreadsheet. If you do not have the software to actually open the spreadsheet, use the second set of links to open images that show how a spreadsheet looks. The images open in a new window.
Do It! Google Spreadsheet The example below is a Google Spreadsheet, which you can view here if you are online but not edit. It has 4 sheets (tabs at the bottom of the frame). For a full set of lessons on spreadsheets, go to the section: Working with Numbers
Date: 2015-01-11; view: 913
|


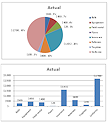


 Look for the spreadsheet features listed above. [rows, columns, cells, formulas, and charts]
