CATEGORIES:
BiologyChemistryConstructionCultureEcologyEconomyElectronicsFinanceGeographyHistoryInformaticsLawMathematicsMechanicsMedicineOtherPedagogyPhilosophyPhysicsPolicyPsychologySociologySportTourism
SUB-UNIT 4.3. Presenting statistic data
You know that one of the tasks that the sociologist should perform in his/her everyday working life is expressing and interpreting facts and proportions of sociological data using adequate professional language; the first step to acquiring these skills is making generalised statements about information presented in charts, diagrams and tables.
&Task 1.Look at the bar chart showing the percentage of households with certain durable goods in Great Britain. Use the following word combinations to describe the changes in consumer spending policy.
- to increase slightly;
- to fall sharply;
- to change very little;
- to rise significantly;
- to doubled;

Diagram 1: Percentage of households with certain durable goods (G.B.)
Ö Task 2. Read the summary below and correct factual mistakes:
The bar chart shows the changes in the number of durable goods bought by people in Great Britain in the period between 1969 – 1987. It can be seen from the chart that there was a minimal rise in the amount of the purchased goods. The biggest increase was in the number of cars, which more than doubled from 32% in 1969 to 67% in 1979. The number of TV-sets also rose significantly. In contrast, the percentage of central heating only increased slightly. Moreover, the number of refrigerators bought in 1979 and 1987 fell sharply.
s Task 3. Which of the figures do you find surprising? How can you comment on these changes? How do they reflect the changes in the life style of the British people? Can you find explanations to these changes in some of the characteristics of the middle class in Great Britain (for example “achievement motivation”, domesticity, social comparability etc.)?
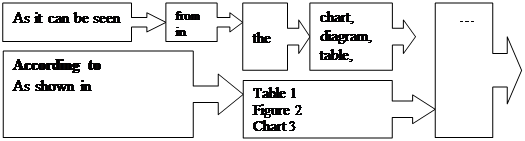
J Task 4. Work in pairs: analyse the following diagram (it is often called a pie chart) about family spending in Britain. What changes took place in the average weekly expenditure (the amount of spent money)? In you opinion, how will British families spend their money in 10 years from now? Give your forecast and back it with the examples of present tendencies that will continue developing in future. For proper wording use the scheme below.
 | |
 |
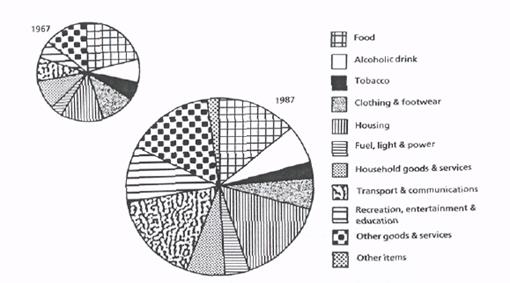
Diagram 2: Average weekly expenditure per family in G.B. (1987)
|
comparing student expenditure in 1996-1997
and 2000-2001.
- How is student expenditure different to
that of other young people?
- How could you account for the changes
in their spending patterns over the period?
Using your active vocabulary write a
summary of the information in about 150
words. Look back at the examples of
presentation of the statistic information to
help you.
Also, think about possible reasons that
determined these changes. Do you suppose
to find similar changes in the expenditure
of Belarussian students? Make your forecast.
J Task 5. Work in pairs: To practice the skills of making generalized statements about the information presented in diagrams and charts analyse the following charts showing the data on the number of British households possessing different types of durable goods (new technologies, means of transport) What changes took place in the number of households in the given period? Which of the figures do you find surprising/rather natural? How can you comment on these changes? How do they reflect the changes in the life style of the British people? Can you find sociological explanations to these changes in some of the characteristics of the middle class in Great Britain?
A:

Diagram 3: New technology: Great Britain, 2000 to 2002
Source: http://www.statistics.gov.uk/cci/nugget.asp?id=994
B:
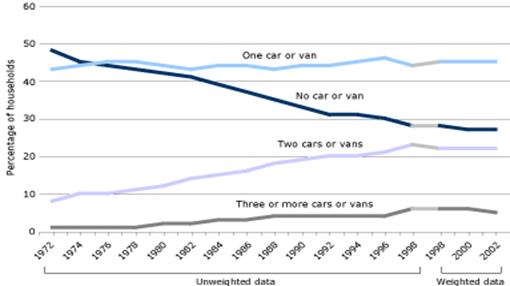
Diagram 4:Households with access to a car or van: 1972 to 2002
Source: http://www.statistics.gov.uk/cci/nugget.asp?id=994
C:

Diagram 5. Percentage of households with consumer durables: Great Britain, 1972 to 2002
Source: http://www.statistics.gov.uk/cci/nugget.asp?id=994
Date: 2016-03-03; view: 3168
| <== previous page | | | next page ==> |
| Socialisation and the middle class | | | The upper-class family |