CATEGORIES:
BiologyChemistryConstructionCultureEcologyEconomyElectronicsFinanceGeographyHistoryInformaticsLawMathematicsMechanicsMedicineOtherPedagogyPhilosophyPhysicsPolicyPsychologySociologySportTourism
Explain the meaning of Gaussian Distribution. Gaussian curve.If an experiment is repeated a great many times and if the errors are purely random, then the results tend to cluster symmetrically about the average value. The more times the experiment is repeated, the more closely the results approach an ideal smooth curve called the Gaussian distribution. In general, we cannot make so many measurements in a lab experiment. We are more likely to repeat an experiment 3 to 5 times than 2 000 times. However, from the small set of results, we can estimate parameters that describe the large set. We can then make estimates of statistical behavior from the small number of measurements.
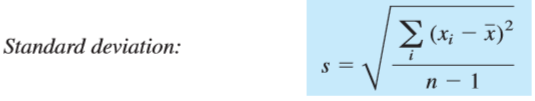
In the hypothetical case in Figure, a manufacturer tested the lifetimes of 4 768 electric light bulbs. The bar graph shows the number of bulbs with a lifetime in each 20-h interval. Lifetimes approximate a Gaussian distribution because variations in the construction of light bulbs, such as filament thickness and quality of attachments, are random. The smooth curve is the Gaussian distribution that best fits the data. Any finite set of data will vary somewhat from the Gaussian curve. Light bulb lifetimes, and the corresponding Gaussian curve, are characterized by two parameters. The arithmetic mean, X—also called the average—is the sum of the measured values divided by n, the number of measurements: Mean: where xi is the lifetime of an individual bulb. The Greek capital sigma, Σ, means summation:Σ The standard deviation, s, measures how closely the data are clustered about the mean. The smaller the standard deviation, the more closely the data are clustered about the mean
In Figure, s=94.2 h. A set of light bulbs having a small standard deviation in lifetime is more uniformly manufactured than a set with a large standard deviation. For an infinite set of data, the mean is designated by the lowercase Greek letter mu, μ (the population mean), and the standard deviation is written as a lowercase Greek sigma, σ (the population standard deviation). We can never measure μ and σ, but the values of x and s approach μ and σ as the number of measurements increases. The formula for a Gaussian curve is
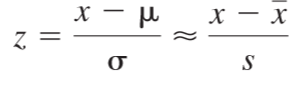
where e is the base of the natural logarithm. For a finite set of data, we approximate μ by x and σ by s. It is useful to express deviations from the mean value in multiples, z, of the standard deviation. That is, we transform x into z, given by
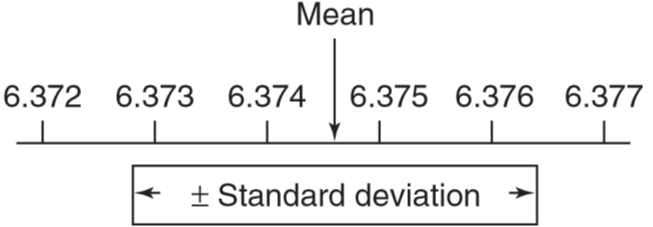
The standard deviation measures the width of the Gaussian curve. The larger the value of σ, the broader the curve. In any Gaussian curve, 68.3% of the area is in the range from μ – 1σ to μ+1σ. That is, more than two-thirds of the measurements are expected to lie within one standard deviation of the mean. Also, 95.5% of the area lies within μ±2σ, and 99.7% of the area lies within μ±3σ.
12) What is the different between the mean and standard deviation? The arithmetic mean, X—also called the average—is the sum of the measured values divided by n, the number of measurements: Mean: where xi is the lifetime of an individual bulb. The Greek capital sigma, Σ, means summation:Σ The standard deviation, s, measures how closely the data are clustered about the mean. The smaller the standard deviation, the more closely the data are clustered about the mean
The mean gives the center of the distribution. The standard deviation measures the width of the distribution. An experiment that produces a small standard deviation is more precise than one that produces a large standard deviation. Greater precision does not necessarily imply greater accuracy, which is nearness to the “truth.”
Date: 2016-01-14; view: 1040
|


 In Figure, the mean value is 845.2 h.