Home Random Page


CATEGORIES:

BiologyChemistryConstructionCultureEcologyEconomyElectronicsFinanceGeographyHistoryInformaticsLawMathematicsMechanicsMedicineOtherPedagogyPhilosophyPhysicsPolicyPsychologySociologySportTourism


Pro Forma Cash Flow

  Year 1 Year 2 Year 3
Cash Received      
Cash from Operations      
Cash Sales $2,186,601 $2,351,541 $2,573,024
Subtotal Cash from Operations $2,186,601 $2,351,541 $2,573,024
Additional Cash Received      
Sales Tax, VAT, HST/GST Received $0 $0 $0
New Current Borrowing $0 $0 $29,559
New Other Liabilities (interest-free) $0 $0 $0
New Long-term Liabilities $0 $0 $0
Sales of Other Current Assets $0 $0 $0
Sales of Long-term Assets $0 $0 $0
New Investment Received $0 $0 $0
Subtotal Cash Received $2,186,601 $2,351,541 $2,602,583
Expenditures Year 1 Year 2 Year 3
Expenditures from Operations      
Cash Spending $322,008 $322,008 $322,008
Bill Payments $1,633,772 $1,677,517 $1,773,221
Subtotal Spent on Operations $1,955,780 $1,999,525 $2,095,229
Additional Cash Spent      
Sales Tax, VAT, HST/GST Paid Out $0 $0 $0
Principal Repayment of Current Borrowing $23,160 $26,435 $0
Other Liabilities Principal Repayment $0 $0 $0
Long-term Liabilities Principal Repayment $27,430 $29,329 $31,339
Purchase Other Current Assets $0 $0 $0
Purchase Long-term Assets $0 $0 $0
Dividends $0 $0 $0
Subtotal Cash Spent $2,006,370 $2,055,289 $2,126,568
Net Cash Flow $180,231 $296,252 $476,015
Cash Balance $280,231 $576,483 $1,052,498

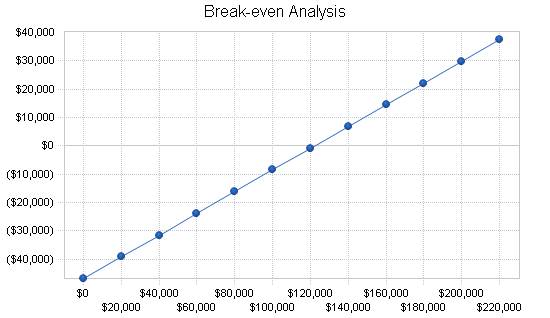
7.3 Key Financial Indicators

The most important indicators in our case are are daily seating "counts" and weekly sales numbers. We must also make sure that we are turning our inventory rapidly so as to avoid food spoilage.

We must target net profit/sales figures toward the 14% level with gross margins never dipping below 38%. Marketing costs should never exceed three percent of sales.

7.4 Break-even Analysis

The Break-even Analysis shows that The Watertower has a good balance of fixed costs and sufficient sales strength to remain healthy. Our break-even point is $106,101 on sales averaging $12.54 per patron. This break-even position is achieved on a monthly fixed cost of $57,873 and per unit/patron variable cost of $5.70.

7.5 Projected Profit and Loss

We expect income to approach $2.1 million for calendar year 2002. It should increase to $2.57 million by the end of the years covered in this plan.


Date: 2016-01-05; view: 950


<== previous page | next page ==>
Strategy and Implementation Summary | The Management Process
doclecture.net - lectures - 2014-2024 year. Copyright infringement or personal data (0.006 sec.)