CATEGORIES:
BiologyChemistryConstructionCultureEcologyEconomyElectronicsFinanceGeographyHistoryInformaticsLawMathematicsMechanicsMedicineOtherPedagogyPhilosophyPhysicsPolicyPsychologySociologySportTourism
Chapter 4. results: an amber planet
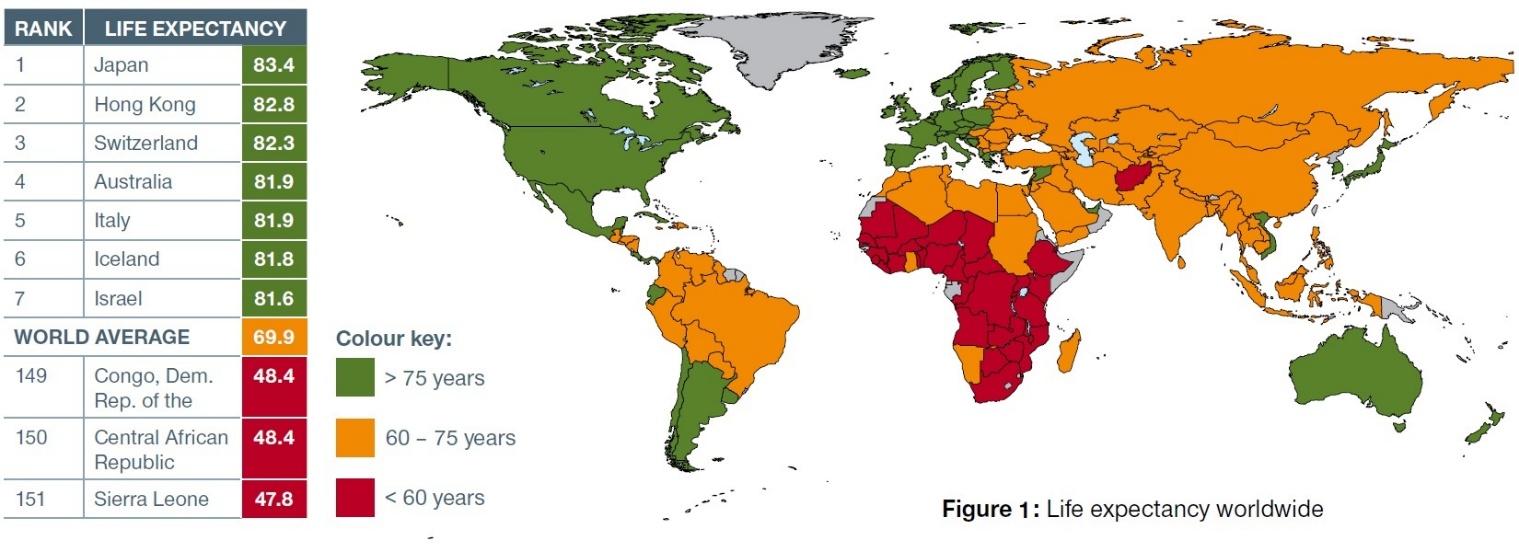
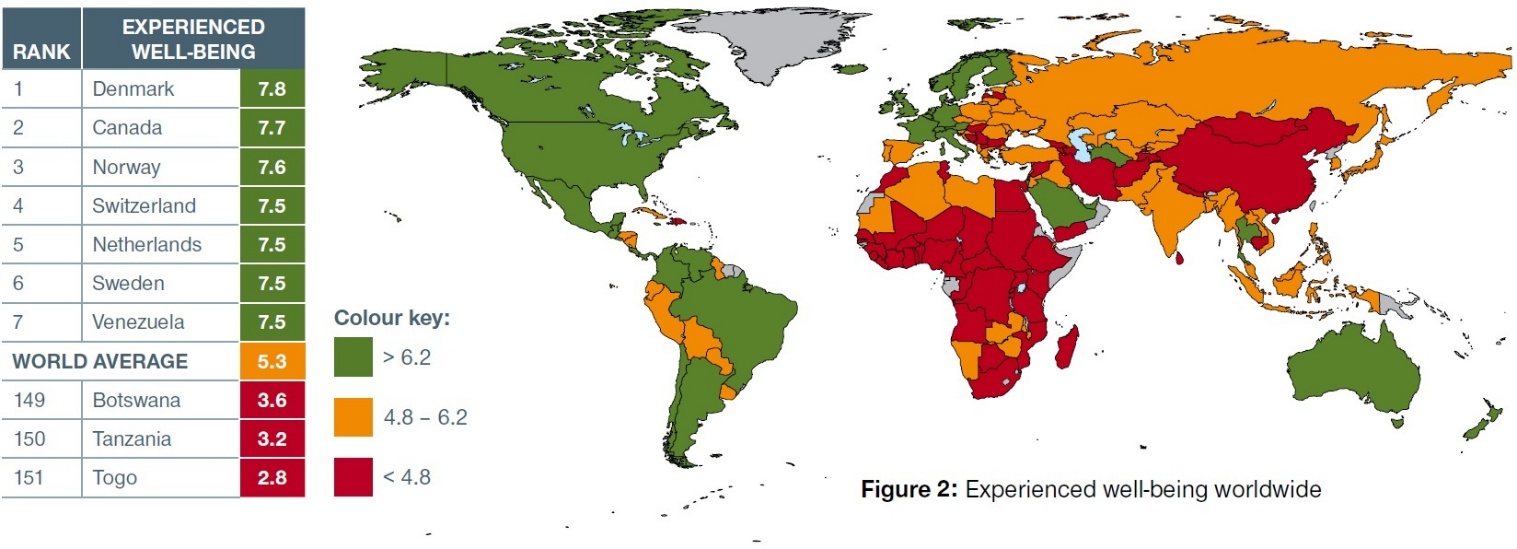
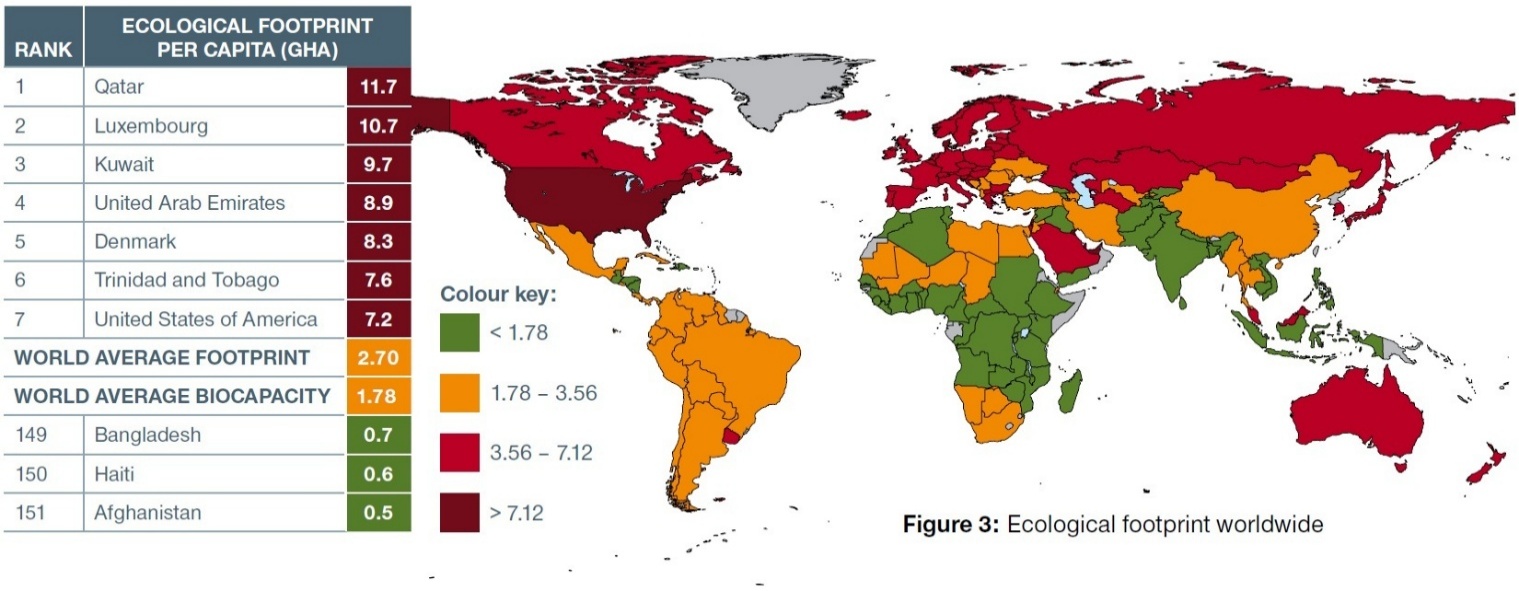
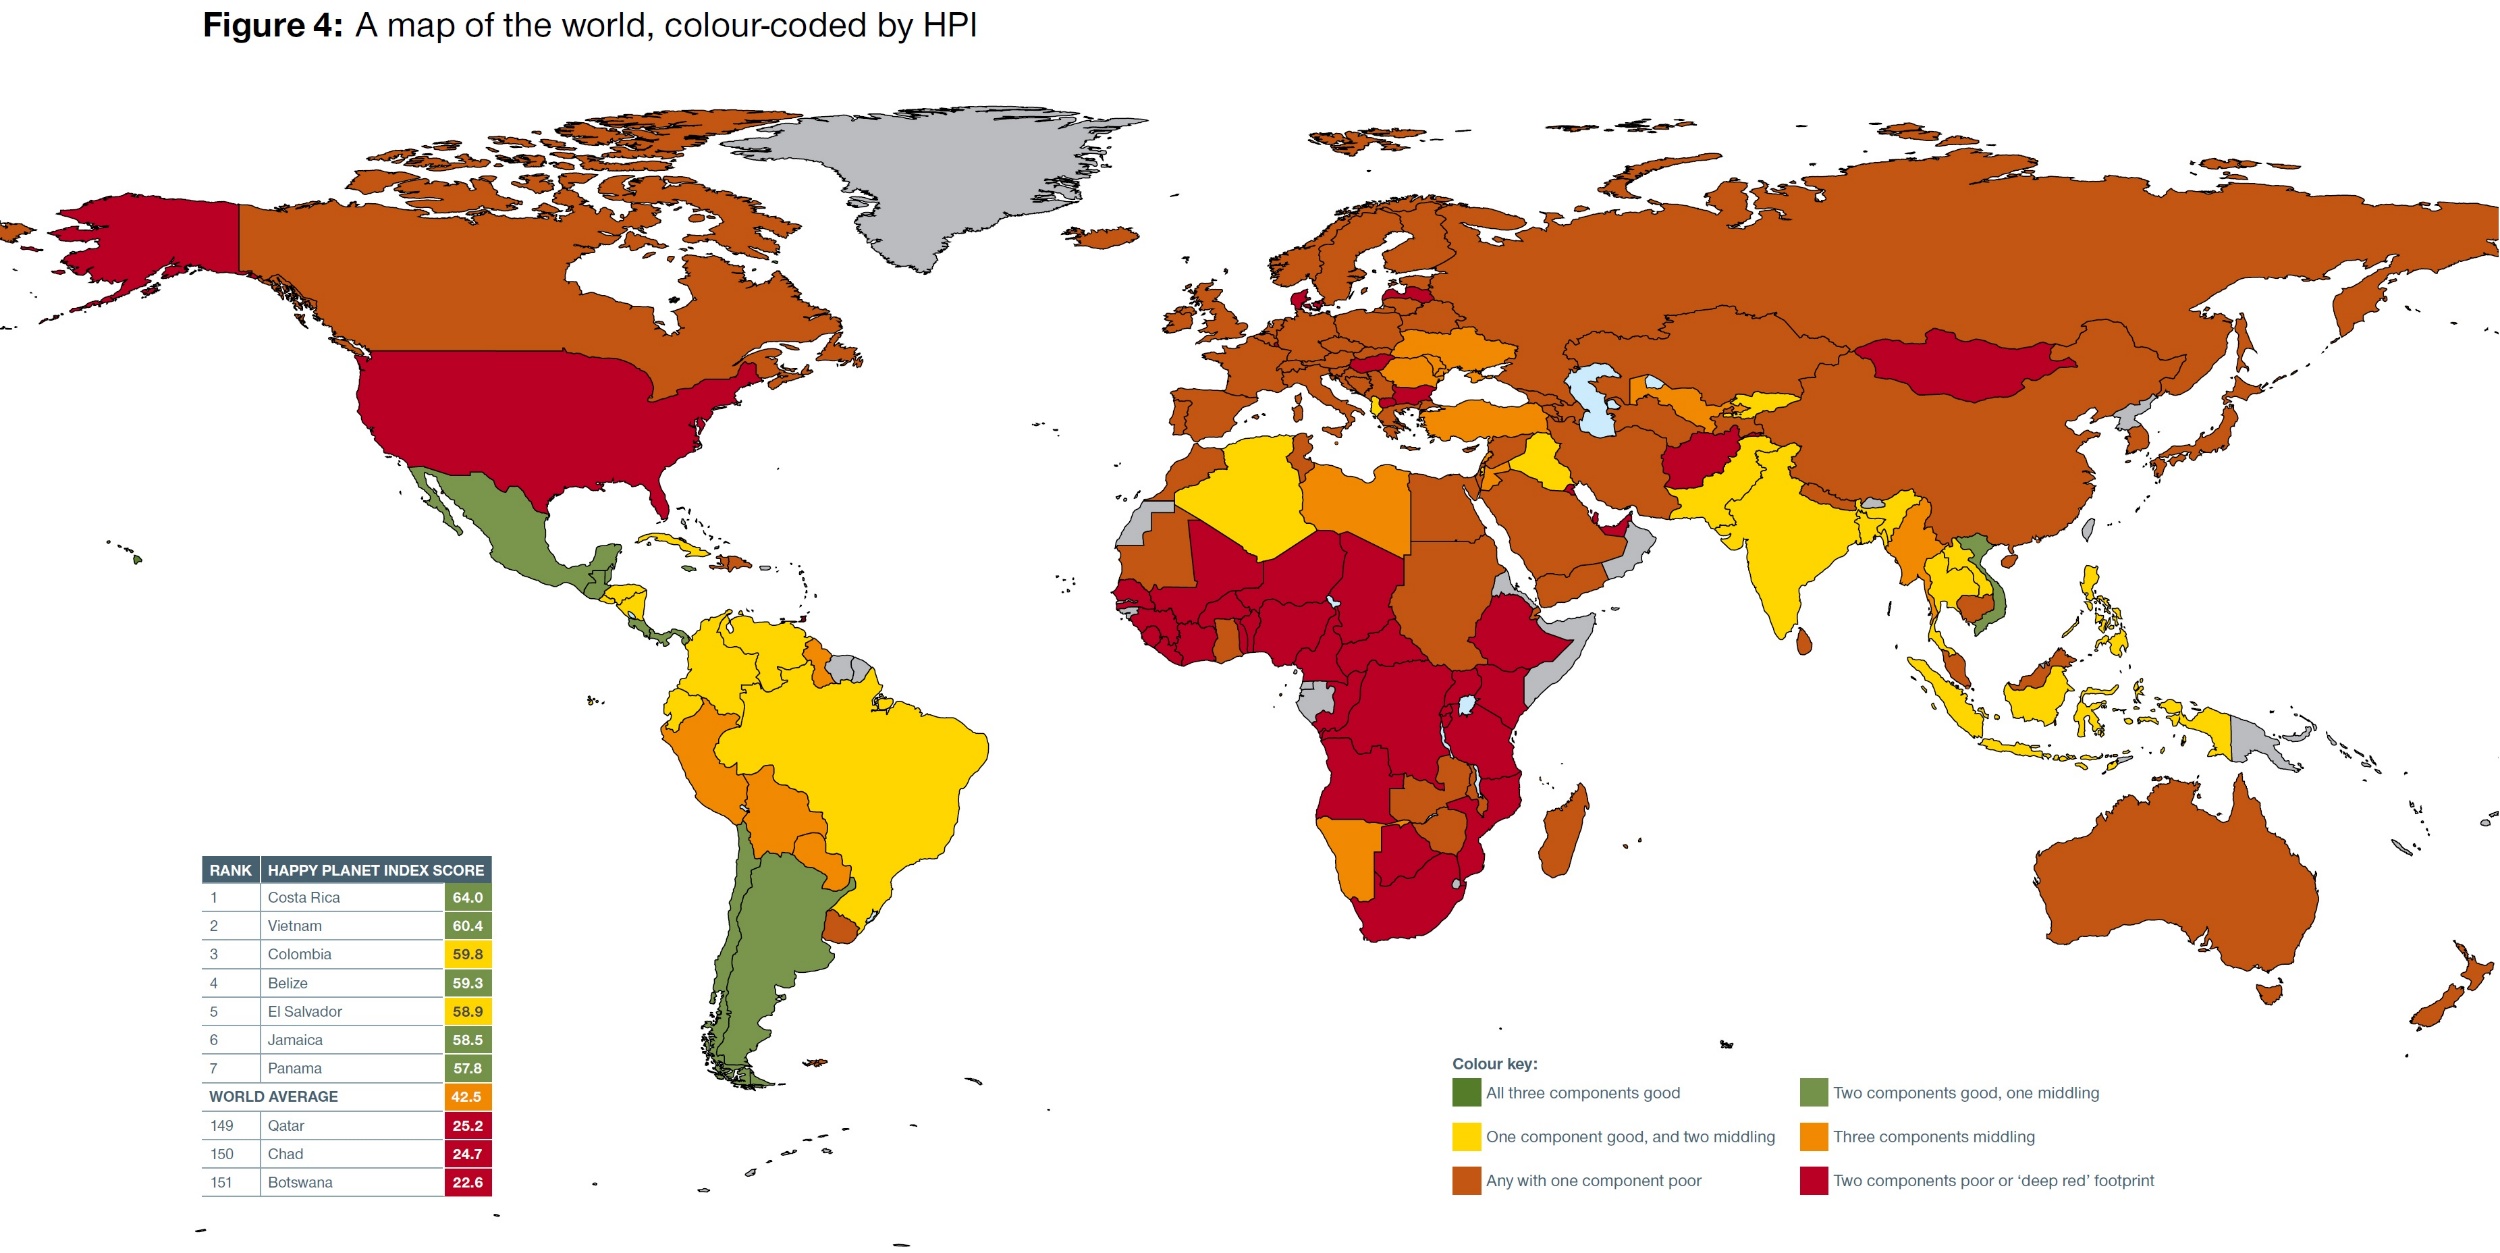
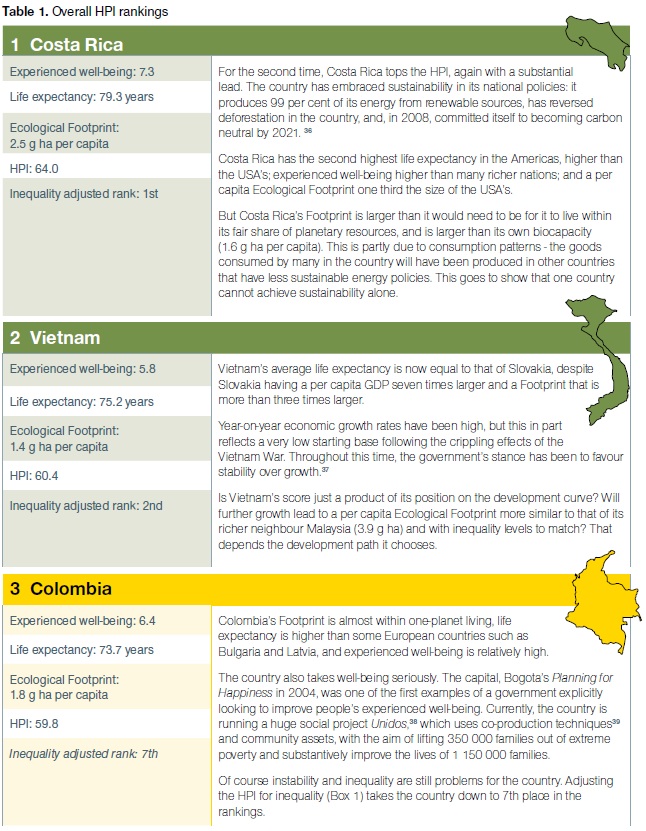
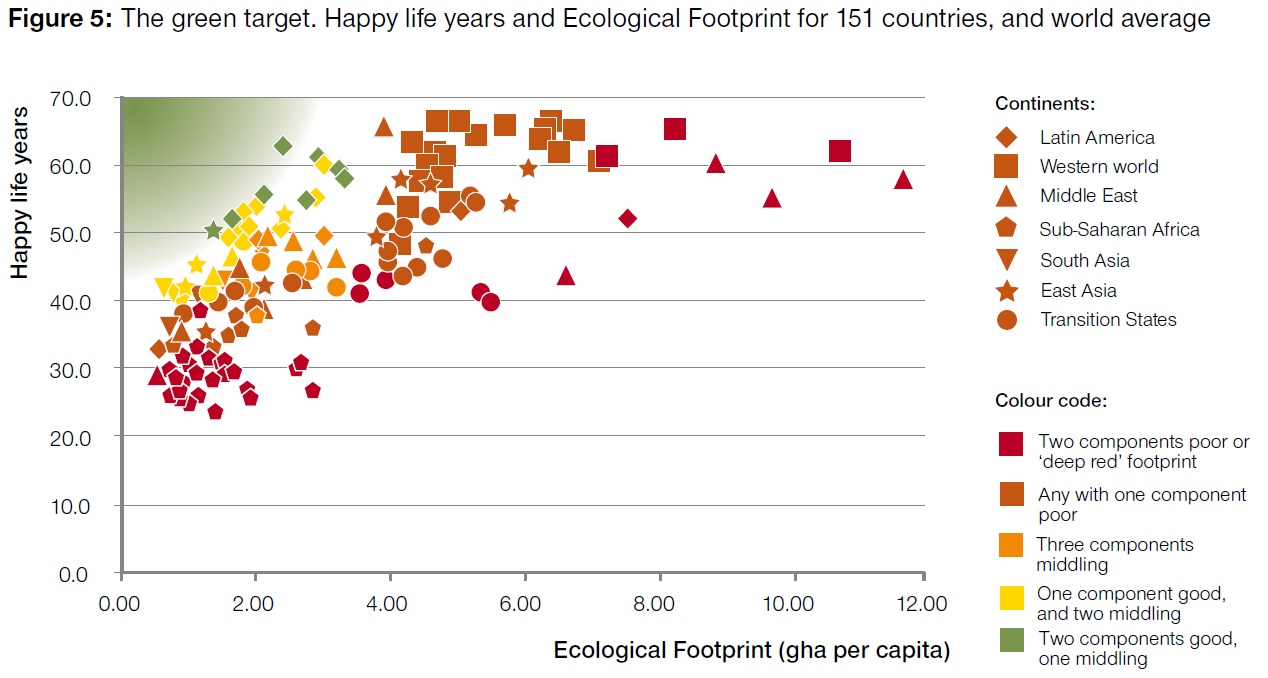
This year’s results confirm that we are still not living on a happy planet. Figures 1 to 3 map out national performance on each of the three component indicators (life expectancy, experienced well-being, and Ecological Footprint), and highlight the top and bottom countries on each. Figure 4 shows the combined score of the components brought together for the HPI itself, as well as presenting the top and bottom countries in terms of HPI. The maps reveal that the warning lights are glaring brighter than ever before – no country achieves bright green in the HPI map, indicative of good performance on all three components. Indeed, only nine are in the second-best category (light green). Eight of those nine are in Latin America and the Caribbean. Two are classified as very high development by the UN (Argentina and Chile), five as high development (Mexico, Costa Rica, Panama, Jamaica, and Belize), and two as medium development (Vietnam and Guatemala). Indeed, amongst the top 40 countries by overall HPI score, only four countries have a GDP per capita of over $15,000. The highest ranking Western European nation is Norway in 29th place, just behind New Zealand in 28th place. The USA is in 105th position out of 151 countries. In all cases, the scores of high income countries are brought down considerably by their large Ecological Footprints. The USA’s Footprint was 7.2 g ha in 2008. If everyone on the planet were to live like Americans did in 2008, we would need four planets to maintain our consumption. Given this context, Table 1 takes a closer look at the three countries that top the overall HPI rankings. As well as providing the key statistics for each one, we also report a ranking for the countries which takes inequality in well-being into account. How do high-income Western countries compare with these three? Figure 5 provides a way of looking at this question. It plots countries in terms of their Ecological Footprint and Happy Life Years. The target is the top left corner – high Happy Life Years and a Footprint below 1.8 g ha. Countries like Costa Rica are close to this target, though not there yet. High-income countries are spread across the top, from the top middle to the top right. Qatar, for example, has an average experienced well-being score of 6.6 out of 10, and life expectancy of 78.4 years (both below those of Costa Rica). And yet its Footprint is 11.7 g ha per capita – over four times higher than Costa Rica’s. As a result it ranks 149th out of 151 countries in this year’s HPI. New Zealand, by contrast, achieves much higher experienced well-being (7.2 out of 10) and life expectancy (80.7 years), but with a much smaller Footprint – 4.3 g ha per capita. This is still far from being sustainable (being over twice the fair share of 1.8 g ha per capita), but the difference highlights that even amongst high-income countries, there is room for manoeuvre. As a result, New Zealand ranks 28th in the HPI.
Date: 2014-12-21; view: 1392
|