CATEGORIES:
BiologyChemistryConstructionCultureEcologyEconomyElectronicsFinanceGeographyHistoryInformaticsLawMathematicsMechanicsMedicineOtherPedagogyPhilosophyPhysicsPolicyPsychologySociologySportTourism
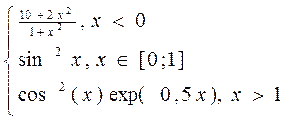
JOB 1. Use of graphic opportunities of MS Excel1. Construct a function graph ó = cos2(px) with õÎ[0, 1]: 1.1.In cells À1, Â1 Ëèñòà1 enter according values Õ, Y with step 0.1 1.2.In cell Â2 enter formula =cos(ÏÈ()*À2)^2 and copy this formula into block of cells Â3:Â12 1.3.Mark out values Õ and Ó, exert master of charts, choose the chart Diagram, correctly fill dialogue fields 2. Construct in one system of coordinates of graphics of the following functions at õÎ[-2, 2] with step 0.2: Ó=
Note: in cell Â2 enter formula =ÅÑËÈ(À2<=0;6*sin(A2)^2-cos(A2); 4*A2^3*sin(A2)^2) in cell C2 enter formula =ÅÑËÈ(À2<0;(10+2*A2^2)/(1+A2^2);ÅÑËÈ(È(À2>=0;A2<=1);sin(A2)^2;cos(A2)^2*exp(0,5*A2)))
JOB 2. Creation of function graphs 1. To construct in one system of coordinates of graphics of the following functions at õÎ[-2; 2]: y=2sin(x)cos(x) z=3cos2(x)sin(x) 1.1. In the cells À1, Â1, nd Ñ1 Ëèñòà2 enter according Õ, Y è Z 1.2. In the range of cells À2:À22 enter values of argument Õ from -2 to 2 with step 0.2 In the cell Â2 and Ñ2 enter formula =2*sin(À2)*cos(À2) and =3*cos(À2)^2*sin(À2) accordingly Copy these formulas into block of cells Â3:Ñ22 Mark all of the table and create the chart Diagram 2.Create the chart of function with three conditions when õÎ[-1.5; 1.8] with step 0.2:
JOB 3. Create the chart of function with two conditions whenõÎ[-1.8; 1.8] with step 0.2
in the cells À1, Â1 enter accordingly Õ, Y in the range of cells À2:À20 enter values of argument Õ from -1.8 to 1.8 with step 0.2 in the cell Â2 enter the formula with the help of Master of functions: =ÅÑËÈ(A2<=0;(3+sin(A2))/(1+A2^2);2*A2^2*cos(A2)^2) and copy the formula into the range of cells Â3:Â20 create the table of functions.
JOB 4. On the Page4 create in different systems of coordinates when õÎ[-1.4;1.9] with step 0.2 charts of following functions:
JOB 5. Creation of surface. Solution of the equations with the method of selecting parameters 1. On a blank work sheet construct a surface z=3e0.3xx3-3y4 when õ, y Î[-1, 1]with changing step 0.2,for it: · In the range of cells À2:À12 enter following of values of changing Õ with step 0.2 (in À2 enter «-1», in À3 enter «-0,8», mark these two cells and «stretch» to À12) · In the range of cells B1:L1enter following of values of changing Y with step 0.2 (in B1 enter «-1», in Ñ3 enter «-0,8», mark these two cells and «stretch» to L1) · In the cell Â2 enter formula =3*EXP(0,3*$A2)*$A2^3-3*B$1^4 and with the help of filling marker fill the block of cells B2:L12 with correspondind formulas. Mark the range of formulas À1:L12 and create the chart Surface 2. Create in different systems of coordinates of surfaces when x, yÎ [-1,1] with step 0.2 z1=x2-3y2 z2
z3 = xe2x – y, if 0.5 £½x + y½< 1 2ex–yey, if 1 £ çx + yç.
z4 = 2x2 - ey, if 0.5 £ |x| + |y| < 1 e2x - y, if 1 £ |x| + |y| 3. Solve an equation õ3-0,01õ2-0,7044õ+0,139104=0 by trial and error, for it: 3.1. Enter into cell À2 value «–1», into cell À3 value «–0,8». Marking these two values, stretch the filling marker (dagger in the right bottom corner of a cell) till value «1». In the cell Â2 enter formula: =À2^3-0.01*A2^2-0.7044*A2+0.139104 (left part of equation), with the filling marker fill the other values 3.3. Note that the function change the sign on intervals [-1;-0.8], [0.2;0.4], [0.6;0.8], thus it is reasonable to take average points of intervals for initial approximations of a root. Enter them in the cells Ñ2; Ñ3; Ñ4 3.4. In the cell D2 enter the formula: =Ñ2^3-0.01*Ñ2^2-0.7044*Ñ2+0.139104, with the filling marker stretch the other values. 3.5. Mark the cell D2 . 3.6. Choose the command Service/Selection of parameter. On the screen the Parameter Selection window will be displayed, in the field to Establish in a cell the cell will be displayed D2, in the field Value enter 0. Here value of the right part of equation is specified. In the field Changing value of a cell enter Ñ2, using the reference to this cell, e.i. with the mouse. In this field the reference to the cell which has been taken away under a variable is given. 3.7. Enter ÎÊ. 3.8. Similarly in cells of C3 and C4 there are two remained roots. 3.9. In the graphic way show equation roots, i.e. construct a function graph y.
4. Create the surface õ, ó Î[-1;1] on variations (column «Task¹ 1») 5. Find the roots of equation on variations (column «Task¹ 2»)
Date: 2015-12-24; view: 1932
|
 Z=
Z= 


 2x2 – ey, if çx + y½ < 0.5,
 x - e2y, if |x| + |y| < 0.5,