CATEGORIES:
BiologyChemistryConstructionCultureEcologyEconomyElectronicsFinanceGeographyHistoryInformaticsLawMathematicsMechanicsMedicineOtherPedagogyPhilosophyPhysicsPolicyPsychologySociologySportTourism
The Weekly Chart Analysis
Preliminary analysis on weekly charts is conducted at the end of the week, and is supposed to be updated at the end of each trading day.
(The fact that you prefer a short-term trade is not so important. Longer-term market analysis should be done even if you consider yourself as a day trader and the majority of your positions are taken and liquidated within the same trading day. To make a right decision on an intraday trade, you also have to see the bigger picture, to identify key levels and current longer-term trends. As a matter of fact, dividing the FOREX mar- ket participants among short-term, intermediate-term and long-term traders seems a bit artificial to me. For example, I personally never refuse to keep my position open for a longer period of time if there is a strong reason to believe that the current trend will continue. Transforming an in- traday trade into a positional trade, revising my initial plan and changing the time frame can do the necessary adjustment.)
The purpose of this analysis is to define the prevalent intermediate- to longer-term trends and identify on the chart critical points, zones, and lev- els. Those levels should be located relatively close to the previous week’s closing price and within the reach of a potential next week’s range. All technical formations and patterns have to be taken into consideration and identified as well. The trendlines should be drawn and the measured ob- jective targets (if any) calculated. The charts, along with the lines drawn on them, should be saved in your computer and updated every day.
(The Omega SuperCharts (end-of-day) software, which I use for inter- mediate and long-term analysis, is the best software I know. This com- puter program allows you to save in the memory a large number of graphic windows with lines drawn on them and, if it is necessary, any number of indicators.)
Every day, in accordance with the market’s changes, you should plot a new day bar and revise the lines that have been drawn on the weekly chart the week before. If necessary, remove the old lines and add new ones. For example, even for a day trader all the trendlines, support, and resistance lines lying within 2 to 3 days of an average trading range could
be important. Those critical points that are on a distance up to 300 to 500 pips in both directions from the closing price of the day have to be noted and placed on the chart. The levels nearest to a closing price are the most important and require more attention. You have to precisely calculate the critical point where this level might be penetrated by the market in the nearest future.
The most basic task, but at the same time the simplest, is to define a direction of a current intermediate-term trend. I don’t think anybody has a problem with this definition, because presence or absence of a trend is usually visible from the first look at the chart. Therefore, I want only to re- mind you that analysis should be conducted on both bar charts and line- on-close charts.
• You should begin with the search of already formed technical forma- tions (head and shoulders, double (triple) tops/bottoms, triangles, wedges, flags, channels, etc.). They should be identified in the follow- ing order:
a.complete formations, with already broken trend/or necklines (crit- ical lines)
b.complete formations, but the critical levels have not been broken yet
c.formations, coming nearer to completion
d.formations that are just starting their development
(In the case of d, we are making some projections for the future. This is the most complicated task, and requires certain practical experi- ence and some imagination from a trader.) After identification of a technical formation, you should draw and save all necessary lines forming this pattern, including the possible measured objective tar- get, if this given formation allows defining it. See Figure 8.10.
• Drawing trend lines and horizontal supports and resistances will be the next step. Identification and allocation on the chart of possible horizontal and inclined channels limited by two trend lines is also very important. Such lines should be drawn only according to certain strict rules. According to the laws of geometry, it’s possible to draw a direct line through any two points in space. Therefore, trend lines, only if they are not necklines of one of the technical formations, will make sense only when they are drawn through a minimum of three important points on the analyzed chart.
• The trend lines should be drawn through three consecutive tops, or three consecutive bottoms, or highs and lows of daily and weekly bars. Preferably, the bars should not intersect the trend line along the way. The line, which has many casual and unconfirmed intersections, is less reliable for a trader. A perfect trend line should be placed on a

FIGURE 8.10 This is a very rare, really technical picture. This is an ideal in- verted head and shoulders formation illustrating any classic textbook description of its appearance and the sequence of its moves. All the necessary elements are present. After breaking the neckline and sizeable follow-through, there was a per- fect correction, which attempted to break the neckline once again but from the op- posite side. Then, a measured objective target was reached.
chart, without being intersected, but only being touched on one side. A trend line that was already infringed in the past, even once, cannot be considered as reliable, and you should build trade plans on its ba- sis with sufficient care. See Figures 8.11 and 8.12.
• Drawing of Fibonacci lines should become the third step, which should be drawn on two kinds of charts: open-high-low-close (OHLC) (bar chart) and line-on-close chart (line chart). These lines should be saved on the charts and regularly revised and clarified according to changes in the market. Fortunately, modern charting and analytical computer programs simplify the process considerably. See Figures 8.13 and 8.14.
• Checking some indicators finishes the analysis of weekly charts. My method assumes very limited use of such tools. From all varieties of indicators, I use only RSI, MACD, and very rarely, slow stochastic. These three indicators serve me as auxiliary only and serve only two purposes: to receive the early warning of a possible turn of the mar- ket, by receiving a divergence signal between the fluctuation chart and listed indicators; or to confirm the change of a trend.

FIGURE 8.11 After numerous false breaks, the trend doesn’t make sense any more and cannot be used as a trading signal—even if (as in this case) the trend has eventually continued.

FIGURE 8.12 On the break of a trendline like the one shown on this chart, a short position should be established.
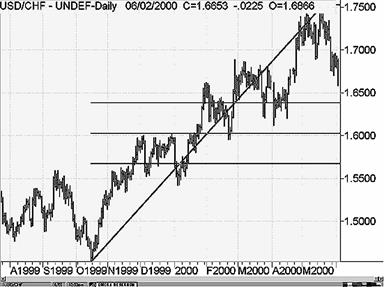
FIGURE 8.13 Fibonacci retracement lines drawn on the USD/CHF daily bar chart.

FIGURE 8.14 Fibonacci retracement measuring tool applied to the line-on-close chart.
Analysis of daily charts is similar to analysis of weekly charts. The dif- ference between them is basically that a smaller time interval allows you to define critical levels and zones more precisely and accurately, to plan a future trade. Furthermore, some formations that cannot be identified on the more large-scale charts, can be visible on the charts with the shorter time frame. In addition to the points just listed, you should conduct the search of gaps on daily and weekly charts.
The FOREX market is densely filled with technical traders and, for this reason, the formations frequently do not fulfill their destination to give traders reliable signals to enter a market and make some projection for the future.
Date: 2015-12-17; view: 1194
| <== previous page | | | next page ==> |
| Evaluating Probabilities Using Technical Analysis | | | Combs on Daily Charts |