CATEGORIES:
BiologyChemistryConstructionCultureEcologyEconomyElectronicsFinanceGeographyHistoryInformaticsLawMathematicsMechanicsMedicineOtherPedagogyPhilosophyPhysicsPolicyPsychologySociologySportTourism
H. Read a part of a business plan and draw the graph of the rate of inflation.Let us look briefly at the way inflation has developed during the period 2001-2006. On the graph in front of you, the horizontal axis represents the years from 2001 to 2006 divided up into six-monthly periods. The vertical axis shows the percentage rate of inflation from zero to 25. Let us now look in detail at the development. If we start with 2001, you can see that at the beginning of the year inflation stood at 5%. It increased steadily over the next 12 months to 8%. The situation improved at the beginning of 2002 and it levelled off for a six months period. The improvement continued and inflation decreased gradually by 2% during the rest of the year. Unfortunately, as you can see, the decline was not maintained and over the next six months inflation rose slightly and reached 9% by the middle of 2003. Then things went bad - I’m sure you will remember how inflation went up dramatically to 17% during the next 12 months and the effects this had on our exports. After a drop of 3% over the second half of 2004 when we all thought that things were improving, inflation increased rapidly until it reached a peak of 24% in the middle of 2005. This marked the low point for us and the high point for inflation. It then fell to 20% by the end of 2005 and levelled off until the middle of 2006. Now let’s look at our results during the same period…
I. What kind of movement do the verbs below describe? Match them to the symbols. Use some symbols more than once.
Events that influenced sale: 1st Quarter: Low consumer demand 2nd Quarter: Price drop 3rd Quarter: Price war with competitors 4th Quarter: Strong holiday buying
WORD FILE
Date: 2015-12-11; view: 1233
|
 1)
1)
 2) 4
2) 4

 3)
3)
 4)
4)
 5) 4
5) 4

 6)
6)
 8)
8)


 6
6
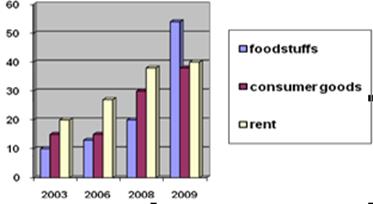
 G. Describe the graphs. Use the expressions from task I.