| I. Aggregate SupplyThe quantity of real GDP supplied is the total quantity of goods and services, valued in constant dollar prices, that firms plan to produce in a given time period. This amount depends on the quantity of labor employed, the capital stock, and the state of technology. In the short run, only the quantity of labor can vary, so fluctuations in employment lead to changes in real GDP.
 Long-Run Aggregate Supply Long-Run Aggregate Supply
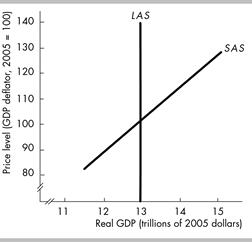
- The long-run aggregate supply curve is the relationship between the quantity of real GDP supplied and the price level in the long run when real GDP equals potential GDP. As illustrated in the figure, the LAS curve is vertical at the level of potential GDP ($13 trillion in the figure), showing that potential GDP does not depend on the specific price level.
- In the long run, the wage rate and other resource prices change in proportion to the price level. So moving along the LAS curve both the price level and the money wage rate change by the same percentage.
Short-Run Aggregate Supply
- The short-run aggregate supply curve is the relationship between the quantity of real GDP supplied and the price level in the short run when the money wage rate, the prices of other resources, and potential GDP remain constant.
- As illustrated in the figure, the SAS curve is upward sloping. This slope reflects that a higher price level combined with a fixed money wage rate, lowers the real wage rate, thereby increasing the quantity of labor firms employ and hence increasing the real GDP firms produce.
Movements Along the LAS and SAS Curves and Changes in Aggregate Supply
Movements Along the Curves
- When the price level, the money wage rate, and other resource prices change by the same percentage, real GDP remains at potential GDP and there is a movement along the LAS curve.
- When the price level changes and the money wage rate and other resource prices remain constant, real GDP departs from potential GDP and there is a movement along the SAS curve.
Shifts in the Curves
- When potential GDP increases, both long-run and short-run aggregate supply increase and the LAS and SAS curves shift rightward. Potential GDP increases when the full employment quantity of labor increases, the quantity of capital increases, or technology advances.
- Short-run aggregate supply changes and the SAS curve shifts when there is a change in the money wage rate or other resource prices. A rise in the money wage rate or other resource prices decreases short-run aggregate supply and shifts the SAS curve leftward.
Date: 2015-12-11; view: 941
|