CATEGORIES:
BiologyChemistryConstructionCultureEcologyEconomyElectronicsFinanceGeographyHistoryInformaticsLawMathematicsMechanicsMedicineOtherPedagogyPhilosophyPhysicsPolicyPsychologySociologySportTourism
Teacher: Sineglazov V.M.
NATIONAL AVIATION UNIVERSITY
AEROSPACE CONTROL SYSTEMS INSTITUTE
DEPARTMENT OF AVIATION COMPUTER INTEGRATED COMPLEXES

ARTIFICIAL NEURAL NETWORKS
REPORT ON LAB:
NETWORKS FOR CLUSTERING
done by _________________________
Group 307
Teacher: Sineglazov V.M.
Kyiv 2011
1. Clustering is the task of assigning a set of objects into groups (called clusters) so that the objects in the same cluster are more similar (in some sense or another) to each other than to those in other clusters.
Clustering is a main task of explorative data mining, and a common technique for statistical data analysis used in many fields, including machine learning, pattern recognition, image analysis, information retrieval, and bioinformatics.
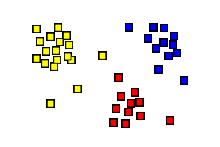
The result of a cluster analysis shown as the coloring of the squares into three clusters.
Besides “clustering” we mean partitioning of the input signals into classes, despite the fact that neither the number nor the signs of the classes are not known. After training, the network is able to determine which class is the input signal. The network also may signal that the input signal does not belong to any of the classes - this is a sign of new, not available in the learning sample data.Thus, such a network may reveal new, previously unknown classes of signals. The correspondence between the classes, dedicated network, and the classes that exist in the domain is set by man. Clustering is carried out, for example, by Kohonen neural networks.
The Self-Organizing Map (SOM), commonly also known as Kohonen network (Kohonen 1982, Kohonen 2001) is a computational method for the visualization and analysis of high-dimensional data, especially experimentally acquired information.
Neural networks in a simple variant of Kohonen can’t be huge, so they are divided into gyperlayers and the nucleus (Microcolumns). If we compare with the human brain, the ideal number of parallel layers should not exceed 112. These layers in turn are gyper layers, in which from 500 to 2000 microcolumns. Moreover, each layer is divided into many giperkolonok penetrating through the layers. Microcolumns coded numbers and units to produce results in the output. If required, the extra layers and neurons are deleted or added.Ideal for the selection of the number of neurons and layers use a supercomputer. This system allows neural networks to be plastic.
2. The notion of a cluster varies between algorithms and is one of the many decisions to take when choosing the appropriate algorithm for a particular problem. At first the terminology of a cluster seems obvious: a group of data objects. However, the clusters found by different algorithms vary significantly in their properties, and understanding these cluster models is key to understanding the differences between the various algorithms. Typical cluster models include:
§ Connectivity models: for example hierarchical clustering builds models based on distance connectivity.
§ Centroid models: for example the k-means algorithm represents each cluster by a single mean vector.
§ Distribution models: clusters are modeled using statistic distributions, such as multivariate normal distributions used by the Expectation-maximization algorithm.
§ Density models: for example DBSCAN and OPTICS defines clusters as connected dense regions in the data space.
§ Subspace models: in Biclustering (also known as Co-clustering or two-mode-clustering), clusters are modeled with both cluster members and relevant attributes.
§ Group models: some algorithms (unfortunately) do not provide a refined model for their results and just provide the grouping information.
A clustering is essentially a set of such clusters, usually containing all objects in the data set. Additionally, it may specify the relationship of the clusters to each other, for example a hierarchy of clusters embedded in each other. Clusterings can be roughly distinguished in:
§ hard clustering: each object belongs to a cluster or not
§ soft clustering (also: fuzzy clustering): each object belongs to each cluster to a certain degree (e.g. a likelihood of belonging to the cluster)
There are also finer distinctions possible, for example:
§ strict partitioning clustering: here each object belongs to exactly one cluster
§ strict partitioning clustering with outliers: object can also belong to no cluster, and are considered outliers.
§ overlapping clustering (also: alternative clustering, multi-view clustering): while usually a hard clustering, objects may belong to more than one cluster.
§ hierarchical clustering: objects that belong to a child cluster also belong to the parent cluster
§ subspace clustering: while an overlapping clustering, within a uniquely defined subspace, clusters are not expected to overlap.

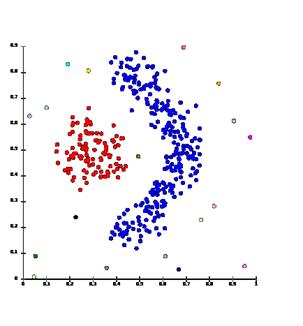
Linkage clustering examples
3. In network architecture we can consider for example a Kohonen map structure.
A self-organizing map consists of components called nodes or neurons. Associated with each node is a weight vector of the same dimension as the input data vectors and a position in the map space. The usual arrangement of nodes is a regular spacing in a hexagonal or rectangular grid. The self-organizing map describes a mapping from a higher dimensional input space to a lower dimensional map space. The procedure for placing a vector from data space onto the map is to first find the node with the closest weight vector to the vector taken from data space. Once the closest node is located it is assigned the values from the vector taken from the data space.
4.
Algorithm
1. Randomize the map's nodes' weight vectors
2. Grab an input vector
3. Traverse each node in the map
1. Use Euclidean distance formula to find similarity between the input vector and the map's node's weight vector
2. Track the node that produces the smallest distance (this node is the best matching unit, BMU)
4. Update the nodes in the neighborhood of BMU by pulling them closer to the input vector
1. Wv(t + 1) = Wv(t) + Θ(t)α(t)(D(t) - Wv(t))
5. Increase t and repeat from 2 while t < λ
Date: 2015-12-11; view: 3396
| <== previous page | | | next page ==> |
| How Tree Bark is Formed | | | The “potential” of can |