CATEGORIES:
BiologyChemistryConstructionCultureEcologyEconomyElectronicsFinanceGeographyHistoryInformaticsLawMathematicsMechanicsMedicineOtherPedagogyPhilosophyPhysicsPolicyPsychologySociologySportTourism
Behaviour of polymersAnother short coming of the Voigt modelis that it fails to describe the stress-relaxationbehaviour of polymers. For stress relaxation de/dt = 0. Substitution of this condition in the Voigt model equation,----- \- e— = — yields a= Ее, which is the description of an elastic rather than viscoelastic material. 5.2.4 Dynamic mechanical thermal behaviour Modulus measurements under dynamic conditions (e.g., sinusoidally oscillating strain and stress) can indicate the viscoelastic nature of polymers, i.e., the modulus term includes elastic and viscous components or real and loss parts. When a viscoelastic material is subjected to a sinusoidally varying deformation (strain), the resultant stress produced in the material will also alternate sinusoidally, but will be out of phase by an angle 5, which is between 0 and n/2. Figures 5.11 and 5.12 show sinusoidally varying stress and strain curves for elastic and viscoelastic behaviours, respectively.
Figure 5.11Illustration of in-phase (5 = 0°) oscillating stress (a) and strain (£) curves
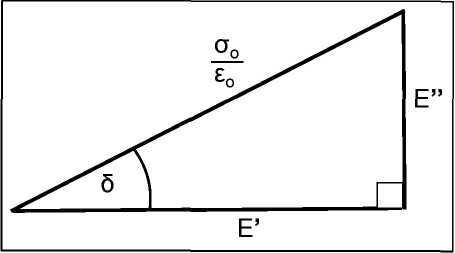
Figure 5.12The variation of stress and strain with time for a viscoelastic material The applied sinusoidal strain can be expressed as: e = 6 sincot Introduction to Polymer Science and Technology Behaviour of polymers where, eo is the maximum strain amplitude, со is the angular frequency (radians per second), and t is time. The resultant stress in the specimen is: a = a sin (cot + 5) or = ao (cos5 sin(cot) + sin5 cos(cot)). This equation implies that the stress can be separated into two components: in phasewith strain (with a stress amplitude of ao cos 5), and тг/2 out of phasewith strain (with a stress amplitude of ao sin 5). When these in-phase and out-of-phase stress amplitudes are divided by the strain amplitude eo, two moduli terms emerge.
_aocos8 „„_aosin8
Figure 5.13 Geometric relationship between the terms E'and E" The diagram shown in Figure 5.13 resembles an Argand diagram for a complex number and, therefore, suggests a complex numberrepresentation for the moduli terms such that E' and E"are the realand imaginary parts ofa complex number E*.Accordingly where, E* is described as the complex modulus, E' is the real (or the storage) modulus, and represents the elastic component of viscoelastic behaviour, E" is the loss modulus (an energy dissipation term), and represents the viscous component of the viscoelastic behaviour, and "i" is the imaginary number (i2 = -1). The Argand diagram for the complex term E*, and an indication of the level of viscoelasticity for some materials is shown in Figure 5.14, where | E* | = ao / eo is the magnitude or the absolute value of E*. Introduction to Polymer Science and Technology Behaviour of polymers
Figure 5.14(a) Argand diagram, (b) levels of viscoelasticity in substances The angle, 5, which reflects the time lag between the applied stress and strain can be expressed as a ratio, known as the energy dissipation factoror a damping termor the loss tangentsuch that; Tan5 = E'7 E' (i.e., the fraction of energy dissipated during each cycle of the oscillations). Damping is a consideration in engineering applications such as anti-vibration engine/motor mountings, sound attenuation, smooth movement in artificial bio-limbs, earthquake anti-tremor mountings and bridge bearings (the runaway vibrations experienced at the inaugural opening of the Millennium Bridge in London was solved by mounting dampers onto the Bridge: sparing the Millennium Bridges blushes). Dampers are used to stop piano strings/wires from continuing to ring after moving to a new note. Introduction to Polymer Science and Technology Behaviour of polymers Dynamic mechanical testsconducted over a wide temperature and frequency range are especially sensitive to the chemical and physical structure of polymeric materials. These tests are the most sensitive tests for studying relaxation transitions such as glass transitionsand secondary glass transitionsin polymers. The instruments for dynamic mechanical thermal testing, which should produce at least a damping term and the real modulus term, may be based on free vibration, resonance forced vibration, non-resonance forced vibration,and wave or pulse propagation.Basic principles of some of these instruments are presented below.
Torsional pendulumis a free-vibration instrument and produces a decaying trace of amplitudes of vibration with time (Figure 5.15). Successive amplitudes, A., decrease because of the gradual dissipation of the energy into heat.
Figure 5.16A magnified segment of the torsion amplitude vs. time trace The logarithmic decrement,Д, is a damping term that can be determined from the dynamic mechanical measurements (see Figures 5.15 and 5.16) generated on a torsion-pendulum Introduction to Polymer Science and Technology Behaviour of polymers
Ai A9
A = In—1- =ln —= ... = ln Ad-l) A; The real modulus,E', can be determined using an equation which incorporates the specimen dimensions and the period (P) of the oscillations. Vibrating reed instrumentsare based on forced resonance vibration: if a strip of material is excited electro-statically at different frequencies, using an audio-frequency oscillator. The specimen would respond by vibrating when the frequency of excitation approaches its resonance frequency. When the frequency reaches the natural resonance frequency of the specimen, the amplitude of the vibration of the free end of the specimen will go through a maximum. It is possible to obtain a plot of the resonance peak (i.e., an amplitude of vibration vs. frequency curve, see Figure 5.17).
Figure 5.17Resonance curve for the vibrating reed The dampingand the real modulusterms can be determined from the band-width, f2- fi;and the resonance frequency, f, of the vibrations such that: f, JL And E'ccfr. Forced vibration,nonresonance, instruments, where often a flat specimen is clamped at both ends and is deformed in a sinusoidal manner, are best for tests over a wide temperature range at a fixed frequency, or for tests over a frequency range at a constant temperature. Most of the commercially available equipment is of forced vibration types. Further coverage of various aspects of this topic is presented in Section 7.4. Introduction to Polymer Science and Technology Behaviour of polymers 5.3 Relaxation transitions The main relaxation transitionsfor crystalline polymersare meltingand for amorphous polymers(or for the amorphous portions of the semi-crystalline polymers) glass transition.Properties show profound changes in the region of glass transition. Polymers that exhibit glass transition are hard, rigidand glass-like below a certain temperature known as the glass-transition temperature, T. Above T the amorphous polymers are soft and flexible,and become either elastomeric or a very viscous liquid. Therefore, for rigid polymers: T > room temperature for elastomers: T < room temperature. Mechanical propertiesshow significant changes in the region of glass transition, e.g., the elastic modulus may decrease by a factor of 1000. Most physical properties (thermal, electrical and optical) also change rapidly in the glass transition region. T of a polymer can be readily determined by using dynamic mechanical thermal analysisdata, differential scanning calirometry or by dilatometric measurements. Figure 5.18 shows a plot of dynamic real (storage) modulus and the damping term (tan6) over a temperature range. The plot provides clear features for identification and determination of T : the point of inflection in the modulus curve or the maximum point in the damping peak can be recorded as T . Date: 2015-12-11; view: 840
|