CATEGORIES:
BiologyChemistryConstructionCultureEcologyEconomyElectronicsFinanceGeographyHistoryInformaticsLawMathematicsMechanicsMedicineOtherPedagogyPhilosophyPhysicsPolicyPsychologySociologySportTourism
Problem Investigation and Diagnosis
An investigation should be conducted to try to diagnose the root cause of the problem – the speed and nature of this investigation will vary depending upon the impact, severity and urgency of the problem – but the appropriate level of resources and expertise should be applied to finding a resolution commensurate with the priority code allocated and the service target in place for that priority level.
There are a number of useful problem solving techniques that can be used to help diagnose and resolve problems – and these should be used as appropriate. Such techniques are described in more detail later in this section.
The CMS must be used to help determine the level of impact and to assist in pinpointing and diagnosing the exact point of failure. The Know Error Database (KEDB) should also be accessed and problem-matching techniques (such as key word searches) should be used to see if the problem has occurred before and, if so, to find the resolution.
It is often valuable to try to recreate the failure, so as to understand what has gone wrong, and then to try various ways of finding the most appropriate and cost-effective resolution to the problem. To do this effectively without causing further disruption to the users, a test system will be necessary that mirrors the production environment.
There are many problem analysis, diagnosis and solving techniques available and much research has been done in this area. Some of the most useful and frequently used techniques include:
- Chronological analysis: When dealing with a difficult problem, there are often conflicting reports about exactly what has happened and when. It is therefore very helpful briefly to document all events in chronological order – to provide a timeline of events. This often makes it possible to see which events may have been triggered by others – or to discount any claims that are not supported by the sequence of events.
- Pain Value Analysis: This is where a broader view is taken of the impact of an incident or problem, or incident/problem type. Instead of just analysing the number of incidents/problems of a particular type in a particular period, a more in-depth analysis is done to determine exactly what level of pain has been caused to the organization/business by these incidents/problems. A formula can be devised to calculate this pain level. Typically this might include taking into account:
- The number of people affected
- The duration of the downtime caused
- The cost to the business (if this can be readily calculated or estimated).
By taking all of these factors into account, a much more detailed picture of those incidents/problems or incident/problem types that are causing most pain can be determined – to allow a better focus on those things that really matter and deserve highest priority in resolving
- Kepner and Tregoe: Charles Kepner and Benjamin Tregoe developed a useful way of problem analysis which can be used formally to investigate deeper-rooted problems. They defined the following stages:
- defining the problem
- describing the problem in terms of identity, location, time and size
- establishing possible causes
- testing the most probable cause
- verifying the true cause.
The method is described in fuller detail in Appendix C.
- Brainstorming: It can often be valuable to gather together the relevant people, either physically or by electronic means, and to ‘brainstorm’ the problem – with people throwing in ideas on what the potential cause may be and potential actions to resolve the problem. Brainstorming sessions can be very constructive and innovative but it is equally important that someone, perhaps the Problem Manager, documents the outcome and any agreed actions and keeps a degree of control in the session(s).
- Ishikawa Diagrams: Kaoru Ishikawa (1915–89), a leader in Japanese quality control, developed a method of documenting causes and effects which can be useful in helping identify where something may be going wrong, or be improved. Such a diagram is typically the outcome of a brainstorming session where problem solvers can offer suggestions. The main goal is represented by the trunk of the diagram, and primary factors are represented as branches. Secondary factors are then added as stems, and so on. Creating the diagram stimulates discussion and often leads to increased understanding of a complex problem. An example diagram is given in Appendix D.
- Pareto Analysis:This is a technique for separating important potential causes from more trivial issues. The following steps should be taken:
- Form a table listing the causes and their frequency as a percentage.
- Arrange the rows in the decreasing order of importance of the causes, i.e. the most important cause first.
- Add a cumulative percentage column to the table. By this step, the chart should look something like Table 4.2, which illustrates 10 causes of network failure in an organization.
| Network failures | |||
| Causes | Percentage of total | Computation | Cumulative % |
| Network Controller | 0+35% | ||
| File corruption | 35%+26% | ||
| Addressing conflicts | 61%+19% | ||
| Server OS | 80%+6% | ||
| Scripting error | 86%+5% | ||
| Untested change | 91%+3% | ||
| Operator error | 94%+2% | ||
| Backup failure | 96%+2% | ||
| Intrusion attempts | 98%+1% | ||
| Disk failure | 99%+1% |
Table 4.2 Pareto cause ranking chart
- Create a bar chart with the causes, in order of their percentage of total.
- Superimpose a line chart of the cumulative percentages. The completed graph is illustrated in Figure 4.5.
- Draw line at 80% on the y-axis parallel to the x-axis. Then drop the line at the point of intersection with the curve on the x-axis. This point on the x-axis separates the important causes and trivial causes. This line is represented as a dotted line in Figure 4.5.
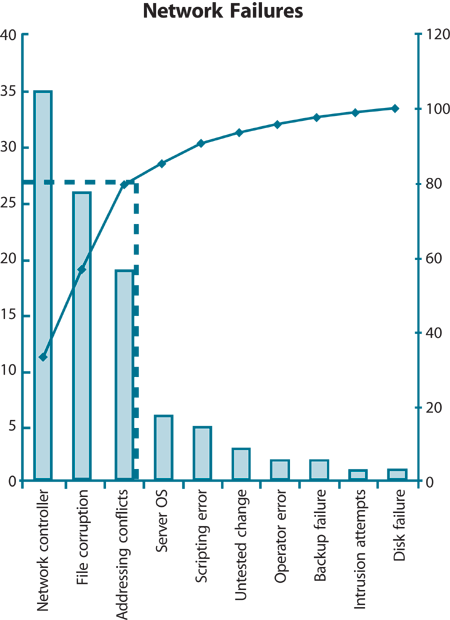
Figure 4.5 Important versus trivial causes
From this chart it is clear to see that there are three primary causes for network failure in the organization. These should therefore be targeted first.
Date: 2014-12-29; view: 1873
| <== previous page | | | next page ==> |
| Critical Success Factors | | | Problem Closure |