CATEGORIES:
BiologyChemistryConstructionCultureEcologyEconomyElectronicsFinanceGeographyHistoryInformaticsLawMathematicsMechanicsMedicineOtherPedagogyPhilosophyPhysicsPolicyPsychologySociologySportTourism
The Distribution Of Income
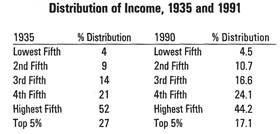 Income distribution can be represented in various ways. Graph 9-10 showed median incomes, but 9-13 contains a Lorenz curve that better illustrates the distribution of income, and its relative equality (or inequality).
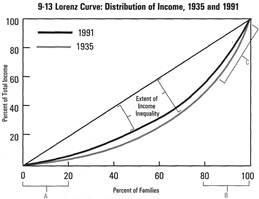 The diagonal line represents what income distribution would look like if it were perfectly equal. That is, if 10 percent of the population received 10 percent of the income, 20 percent received 20 percent of income, and so on.
The solid curved line (Lorenz curve) represents the actual distribution of income as summarized in the table for 1991. The red, curved line represents the data for 1935. Therefore, the area between the 45-degree line and the Lorenz curve represents the extent of inequality of income distribution for the two years. As indicated by this graph, income was somewhat more equally distributed in 1990 than it was 55 years earlier. Some economists believe this trend may be changing. Watch your newspaper for articles about shifts in the distribution of income.
Efforts to Organize Japanese Auto Plants in the U.S. Fails
In 1970, when Americans were buying approximately 7 million cars a year, the United Auto Workers (UAW) had 1.5 million members. By 1989, annual sales of new automobiles rose to over 10 million, but UAW membership fell to less than one million. One reason for the decline was the number of plant closings and layoffs that had occurred over those years. Another was the union's inability to organize newly opened Japanese automobile assembly plants.
In fact, in the summer of 1989 workers at the Nissan Motor Manufacturing Co. plant in Smyrna, Tennessee voted 1,622 to 711 against joining the union. Nissan, with 2,400 workers, was the fourth Japanese auto plant to resist union organization. The others were Honda, with a labor force of 7,000; Toyota with 2,500; and Subaru with 500.
The inability of the union to organize the Japanese-owned plants worries American manufacturers. Union workers are paid more than nonunion workers. The American companies fear that Japanese plants will be able to manufacture automobiles at a lower cost (and sell them at a lower price) than they can. As one Ford executive put it, the election results at Smyrna put the U.S. auto industry at a competitive disadvantage, because the nonunion workforce saved the Japanese companies several hundred dollars on the average cost per vehicle.
Date: 2015-02-28; view: 1020
| <== previous page | | | next page ==> |
| Wage Determination And The Basic Economic Questions | | | The History of Economic Thought |