CATEGORIES:
BiologyChemistryConstructionCultureEcologyEconomyElectronicsFinanceGeographyHistoryInformaticsLawMathematicsMechanicsMedicineOtherPedagogyPhilosophyPhysicsPolicyPsychologySociologySportTourism
Applications of the Production Possibilities Model
Visionary Goals
are the lofty objectives that the firm's management decides to pursue. Vision describes some milestone that the firm will reach in the future and may require a decade or more to achieve. In contrast to the core ideology that the firm discovers, visionary goals are selected.
These visionary goals are longer term and more challenging than strategic or tactical goals. There may be only a 50% chance of realizing the vision, but the firm must believe that it can do so. Collins and Porras describe these lofty objectives as "Big, Hairy, Audacious Goals." These goals should be challenging enough so that people nearly gasp when they learn of them and realize the effort that will be required to reach them.
Most visionary goals fall into one of the following categories:
· Target – quantitative or qualitative goals such as a sales target or Ford's goal to "democratize
the automobile".
· Common enemy – centered on overtaking a specific firm such as the 1950's goal of Philip–
Morris to displace RJR.
· Role model – to become like another firm in a different industry or market. For example, a
cycling accessories firm might strive to become "the Nike of the cycling industry."
· Internal transformation – especially appropriate for very large corporations. For example, GE set the goal of becoming number one or number two in every market it serves.
7. Organizational goals and plans
A goal is a future target or end result that an organization wishes to achieve. A plan is the means devised for attempting to reach a goal.
The setting of goals and developing of plans leads to goal attainment and to organizational efficiency and effectiveness. Goals must satisfy the next requirements: goals should be clear, concise, and quantified when possible. At the same time they should be dynamic and reevaluated as the environment and opportunities change. Goals differ according to organizational level. Organizations typically have three levels of goals: strategic, tactical, and operational.
Strategic goals
are broadly defined targets or future end results carried out at the top levels of the organization. Such goals usually focus on long–range issues – 5 years or more in the future – relating to the
organization as a whole.
Tactical goals
are targets or future end results set by middle management for specific departments or units. Tactical goals aim at intermediate–range issues – 1 to 5 years in the future. Goals at this level answer the question what must be done by various departments or units to achieve the results outlined in the strategic goals.
Operational goals
are targets or future end results set by lower management. Such goals orientate toward short–range issues –1 year or less. They address specific, measurable outcomes required from the lower levels.
The three levels of goals form a hierarchy of goals. Goals at each level are synchronized and not working against each other. Goals at various levels fit together to support a united effort geared to ultimately accomplishing organizational goals. So all goals at any level must be coordinated with, and subordinated to the goals of the next higher level.
Management by objectives (MBO) method allows organizations to facilitate the linking of goals and plans. MBO is a philosophy based on converting organizational goals into personal goals. In other words, MBO is the process through which specific goals are set collaboratively for the organization as a whole and every department or unit and individual within it.
Applications of the Production Possibilities Model
LEARNING OBJECTIVES
1. Understand the argument for unrestricted international trade in terms of economic specialization and comparative advantage.
2. Define economic growth in terms of the production possibilities model and discuss factors that make such growth possible.
3. Explain the classification of economic systems, the role of government in different economic systems, and the strengths and weaknesses of different systems.
The production possibilities curve gives us a model of an economy. The model provides powerful insights about the real world, insights that help us to answer some important questions: How does trade between two countries affect the quantities of goods available to people? What determines the rate at which production will increase over time? What is the role of economic freedom in the economy? In this section we explore applications of the model to questions of international trade, economic growth, and the choice of an economic system.
Comparative Advantage and International Trade
One of the most important implications of the concepts of comparative advantage and the production possibilities curve relates to international trade. We can think of different nations as being equivalent to Christie Ryder’s plants. Each will have a comparative advantage in certain activities, and efficient world production requires that each nation specialize in those activities in which it has a comparative advantage. A failure to allocate resources in this way means that world production falls inside the production possibilities curve; more of each good could be produced by relying on comparative advantage.
If nations specialize, then they must rely on each other. They will sell the goods in which they specialize and purchase other goods from other nations. Suppose, for example, that the world consists of two continents that can each produce two goods: South America and Europe can produce food and computers. Suppose they can produce the two goods according to the tables in Panels (a) and (b) ofFigure 2.12 "Production Possibilities Curves and Trade". We have simplified this example by assuming that each continent has a linear production possibilities curve; the curves are plotted below the tables in Panels (a) and (b). Each continent has a separate production possibilities curve; the two have been combined to illustrate a world production possibilities curve in Panel (c) of the exhibit.
Figure 2.12 Production Possibilities Curves and Trade
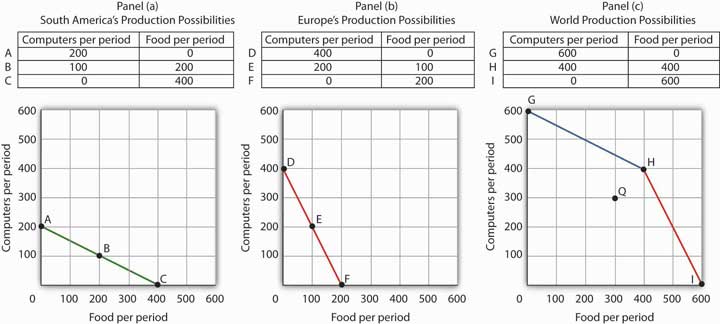
Suppose the world consists of two continents: South America and Europe. They can each produce two goods: food and computers. In this example, we assume that each continent has a linear production possibilities curve, as shown in Panels (a) and (b). South America has a comparative advantage in food production and Europe has a comparative advantage in computer production. With free trade, the world can operate on the bowed-out curve GHI, shown in Panel (c). If the continents refuse to trade, the world will operate inside its production possibilities curve. If, for example, each continent were to produce at the midpoint of its production possibilities curve, the world would produce 300 computers and 300 units of food per period at point Q. If each continent were to specialize in the good in which it has a comparative advantage, world production could move to a point such as H, with more of both goods produced.
The world production possibilities curve assumes that resources are allocated between computer and food production based on comparative advantage. Notice that, even with only two economies and the assumption of linear production possibilities curves for each, the combined curve still has a bowed-out shape. At point H, for example, South America specializes in food, while Europe produces only computers. World production equals 400 units of each good. In this situation, we would expect South America to export food to Europe while Europe exports computers to South America.
But suppose the regions refuse to trade; each insists on producing its own food and computers. Suppose further that each chooses to produce at the midpoint of its own production possibilities curve. South America produces 100 units of computers and 200 units of food per period, while Europe produces 200 units of computers and 100 units of food per period. World production thus totals 300 units of each good per period; the world operates at point Q in Figure 2.12 "Production Possibilities Curves and Trade". If the two continents were willing to move from isolation to trade, the world could achieve an increase in the production of both goods. Producing at point H requires no more resources, no more effort than production at Q. It does, however, require that the world’s resources be allocated on the basis of comparative advantage.
The implications of our model for trade are powerful indeed. First, we see that trade allows the production of more of all goods and services. Restrictions on trade thus reduce production of goods and services. Second, we see a lesson often missed in discussions of trade: a nation’s trade policy has nothing to do with its level of employment of its factors of production. In our example, when South America and Europe do not engage in trade and produce at the midpoints of each of their respective production possibilities curves, they each have full employment. With trade, the two nations still operate on their respective production possibilities curves: they each have full employment. Trade certainly redistributes employment in the two continents. In South America, employment shifts from computer production to food production. In Europe, it shifts from food production to computer production. Once the shift is made, though, there is no effect on employment in either continent.
Of course, this idealized example would have all of South America’s computer experts becoming farmers while all of Europe’s farmers become computer geeks! That is a bit much to swallow, but it is merely the result of assuming linear production possibilities curves and complete specialization. In the real world, production possibilities curves are concave, and the reallocation of resources required by trade is not nearly as dramatic. Still, free trade can require shifts in resources from one activity to another. These shifts produce enormous benefits, but they do not come without costs.
Nearly all economists agree that largely unrestricted trade between countries is desirable; restrictions on trade generally force the world to operate inside its production possibilities curve. In some cases restrictions on trade could be desirable, but in the main, free trade promotes greater production of goods and services for the world’s people. The role of international trade is explored in greater detail in subsequent chapters of this book.
Date: 2014-12-21; view: 1809
| <== previous page | | | next page ==> |
| Visionary goals | | | The Sources of Economic Growth |