CATEGORIES:
BiologyChemistryConstructionCultureEcologyEconomyElectronicsFinanceGeographyHistoryInformaticsLawMathematicsMechanicsMedicineOtherPedagogyPhilosophyPhysicsPolicyPsychologySociologySportTourism
Effectiveness analysisof risk managementin China construction bank
In2013,theGrouprecordedprofitbeforetaxof279,806million,up11.28%over2012.Netprofitwas215,122 million,up11.12%over2012ThesteadygrowthoftheGroup’sprofitabilitywasmainlyduetothefollowingfactors:First, theinterest-earningassetsincreasedmoderately,pushingupnetinterestincomeby36,342million,or10.29%over2012.Second,theGroupactivelyconductedserviceandproductinnovations,withthenetfeeandcommissionincomesteadilyincreasingby10,776million,or11.52%overthepreviousyear.Andthird,theGroupfurtherimproveditscostmanagementandoptimiseditsexpensesstructure,resultinginasignificantdecreaseinthegrowthrateofoperatingexpensescomparedwiththatoflastyear. Thetable 2.10setsforththeGroup’scompositionofthestatementofcomprehensiveincomeandthechangesduringtherespectiveperiods.
Table 2.10 -TheGroup’scompositionofthestatementofcomprehensiveincome
In 2013, the Group’s net interest income was 389,544 million, an increase of 36,342 million, or 10.29%, over the previous year. The net interest income accounted for 76.21% of the operating income. Figure 2.7 shows changes in net interest income , net fee and commission income , operating income.
Figure 2.7 - TheGroup’scompositionofthestatementofincome
In 2012, the Group’s net interest income was 353,202 million, an increase of 48,630 million, or 15.97%, over the previous year. The net interest income accounted for 76.36% of the operating income. Table 2.11 sets forth the Group’s average balances of assets and liabilities, related interest income or expense, and average yields or costs during the respective periods.
Table 2.11 - Group’s average balances of assets and liabilities, related interest income or expense of China Construction Bank
In2013,inactiveresponsetochallengesandopportunitiesarisingfrominterestrateliberalisation,theGroupcultivatedandimproveditspricingabilityundertheconditionofinterestrateliberalisation,refineditspricingmodelsandauthorisationmanagement,enhancedthepricingsupportforbranchesandthebankcountersandimproveditsdepositandloanpricingability.Asaresult,theGroupmaintainedrelativelystablenetinterestmarginandnetinterestspread,whichwere2.74%and2.56%,slightlydecreasedbyoneandtwobasispointsyear-on-year,respectively. The net interest income of some banks is more sensitive to changes in interest rates than others. This can vary according to several factors, such as the type of assets and liabilities that are held. Banks with variable rate assets and liabilities will obviously be more vulnerable to changes in interest rates than those with fixed-rate assets. Banks with liabilities that reprice more often or quicker than its assets will also be affected by interest rate changes. Net interest income (NII) is the difference between revenues generated by interest-bearing assets and the cost of servicing (interest-burdened) liabilities. For banks, the assets typically include commercial and personal loans, mortgages, construction loans and investment securities. The liabilities consist primarily of customers' deposits. NII is the difference between interest payments the bank receives on loans outstanding and interest payments the bank makes to customers on their deposits. Netinterestincomeincreasedby36,342million (Table 2.12)overthepreviousyear,inwhichanincreaseof49,705millionwas duetothemovementofaveragebalancesofassetsandliabilities,andadecreaseof13,363millionwasduetothemovementofaverageyieldsorcosts.
Table 2.12 - Theeffectsofthemovementoftheaveragebalancesandaverageinterestratesof China Construction Bank
After calculation we observe positive dynamic. It says about effectiveness of risk management. Bank singled out sucsesfull policy and new management tools.Change in net interest income is 36,342. The greatest impact for this index has volume factor. For some companies, interest income is small or meaningless. For others, such as an insurance company that generates profit by investing the money it holds for policyholders into interest paying bonds, it is a crucial part of the business. For example, in 2014, the insurance industry is approaching a period where the bonds held in the corporate portfolios, the ones that were bought back when interest rates were much higher, will be coming up to their maturity dates. That means the money will have to be put into lower yielding bonds, causing a substantial hit to profits; something very few investors are factoring into their calculation at the moment, causing insurance stocks to be overvalued because past earnings aren't indicative of future interest income.Table 2.13 shows changes in interest income.
Table 2.13 - Forththeaveragebalance ofeachcomponentoftheGroup’sloansandadvancestocustomers
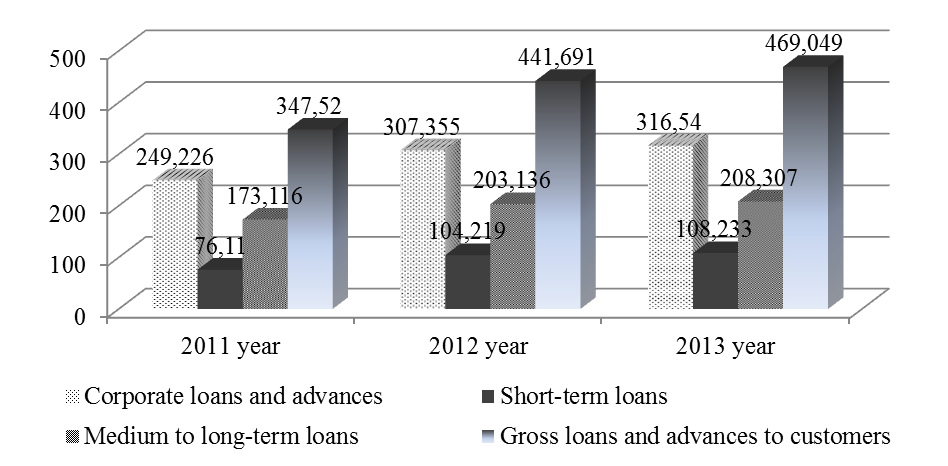
Corporate loans and advances increase on 58,129 or 23 % in 2012 year and on 9185 or 2,9 % in 2013.And Short-term loans increase on 28,109 or 36% in 2012 .In 2013 year this indicator increase on 4,014 or 3,8 %. Personal loans and advances have positive dynamic and increase on 29,854 or 36 %. Figure 2.8 illustrate these increases. In this amount, the proportion of interest income from loans and advances to customers, investments in debt securities, deposits with central banks, deposits and placements with banks and non-bank financial institutions, financial assets held under resale agreements was 73.22%, 16.65%, 5.75%, 3.46% and 0.92% respectively.
Figure 2.8 - Forththeaveragebalance ofeachcomponentoftheGroup’sloansandadvancestocustomers
Interestincomefromloansandadvancestocustomersroseby27,358million,or6.19%year-on-year,to469,049 million,mainlybecausetheaveragebalanceofloansandadvancestocustomersincreasedby15.33%,andtheaverageyieldofloansandadvancestocustomersdecreasedby50basispointsto5.79%overthepreviousyear,mainlyduetotherepricingofexistingloansinterestrate.TheGroupactivelyadjustedcreditstructureandenhancedpricingmanagement,andtheweightedaverageinterestratefornewlygrantedloansmaintainedatagoodlevel. Interestincomefrominvestmentsindebtsecuritiesgrewby9,132million,or9.09%over2012,to109,576million.This wasmainly becausethe averagebalance andaverage yieldof investmentsindebt securitiesincreased over2012, duetotheoptimisationofstructureofinvestmentsportfolio,andincreasedinvestmentsinhigh-yielddebtsecurities. Interestincomefromdepositswithcentralbanksamountedto37,589million,anincreaseof2,895million,or8.34%over2012.Thiswasmainlyduetotheincreaseoftheaveragebalanceofdepositswithcentralbanks. Revenue taken in by financial institutions from account-related charges to customers. Charges that generate fee income include non-sufficient funds fees, overdraft charges, late fees, over-the-limit fees, wire transfer fees, monthly service charges, account research fees and more. Credit unions, banks and credit card companies are types of financial institutions that earn fee income. In 2012, the Group’s net fee and commission income increased by 7.49% over 2011 to 93,507 million. The ratio of net fee and commission income to operating income dropped by 1.56 percentage points to 20.22% (Table 2.13). The slower growth rate of net fee and commission income was mainly due to the following factors: a) with the slowdown of economic growth in China, growth rates of market-related products fell; b) the regulatory standards tended to be more stringent, calling for a higher standard in setting service fees; c) the Group voluntarily waived service charges on certain personal and small business customers. Figure 2.9 present changes of fee and commission income of China Construction Bank. Table 2.13 – Fee and commission income of China Construction Bank
In2013,theGroup’snetfeeandcommissionincomeincreasedby11.52%to104,283million.Theratioofnetfeeandcommissionincometooperatingincomeincreasedby0.18percentagepointsto20.40%.
Figure 2.9 -Fee and commission income of China Construction Bank
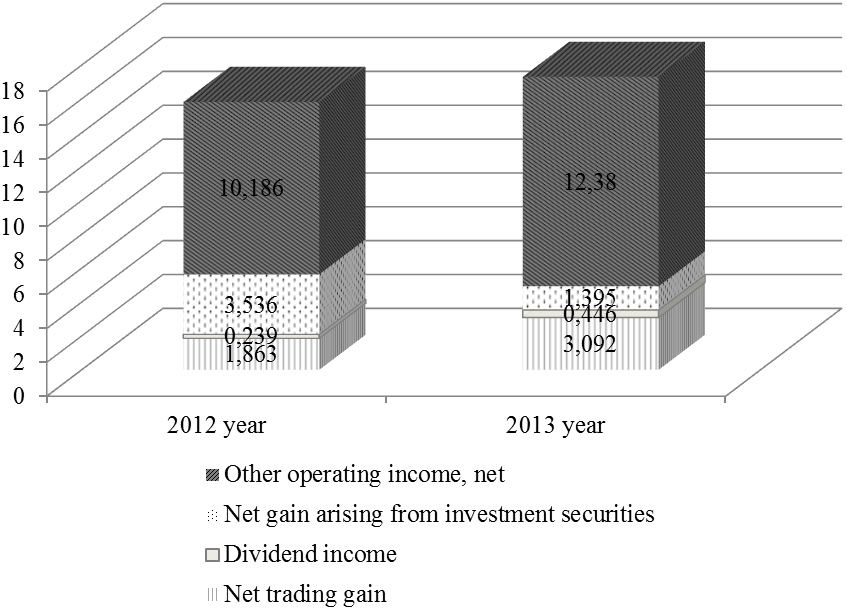
Bankcardfeesgrewby28.04%to25,783million.Inthisamount,feesfromcreditcardsincreasedbynearly50%,mainly becausetheGroupseizedtheopportunitiesofpersonalcustomerconsumptionupgradingandchangesinthewayofpaymenttoactivelyexpandhigh-qualitycustomerbaseandlaunchvariousinnovativeproducts.FeesfromdebitcardsandsettlementservicesthroughATMmaintainedadouble-digitincrease. Consultancyandadvisoryfeesincreasedby7.14%to21,130million.Thegrowthratedroppedfrom2012,mainlyduetothedecreaseinincomefromroutinefinancialadvisoryservices.Incomefromnewfinancialadvisoryservicesandcostadvisory servicemaintainedsteadygrowth. Settlementandclearingfeesincreasedby8.75%to12,422million.Inthisamount,incomefromcorporate settlementsincreasedbyover10%,duetotherapidgrowthofnewsettlementproductssuchasall-in-onecorporateaccount,corporatesettlementcardanddomesticletterofcredit. Agencyservicefeesdecreasedby2.95%to12,395million.Thiswasmainlybecausetheincomefromtrustagency servicedropped.Agencyfundsalesgraduallybottomedoutandincomefromthebusinessincreasedbyover20%. Wealthmanagementservicefeesincreasedby13.85%to10,680million.ItwasmainlybecausetheGroupconstantlylaunchedinnovativeproductsandimprovedcustomerexperienceinconformitywiththediversifiedneedsofdifferentcustomersandfromdifferentchannels,leadingtothescaleexpansionofwealthmanagementproducts.Commissionontrustandfiduciaryactivitieswas9,135million,up9.01%.Inthisamount,incomefromcustodialservicesforsecuritiesinvestmentfunds,insuranceassets,pensionandequityinvestmentfundsgrewsteadily. Electronicbankingservicefeesgrewby20.59%to5,740million.Thiswasmainlyduetothecontinuousenhancementofproductconvenienceandsafetyaswellasthesteadygrowthofcustomerbaseandtradingvolumeofonlinebanking,mobilephonebankingandSMSfinancialservice. Goingforward,theGroupwillstrengthentheanalysisandresearchonmarketandcustomerneeds,andmakeactiveeffortsin refinedmarketingandmanagement.Meanwhile,itwillcontinuouslyenhancecustomers’experiencebyinnovatingproducts,optimisingproceduresandupgradingservices,andmaintainthemarketcompetitivenessoffee-basedbusinessproductsforthesteadygrowthofincomeonthewhole. There are two common measures of the income banks generate from sources other than interest: the non-interest income level and the fee income level. Different banks have very different sources of income. This in turn means they have different profit drivers. Interest income is influenced by both the economic cycle and the level of interest rates. Fee income is cyclical. Non-interest income other than fees (primarily bank charges) is comparatively defensive. Othernetnon-interestincomeoftheGroupincreasedby1,489million,or9.41%overlastyear,to17,313million (Table 2.14).Inthisamount,nettradinggainincreasedby1,229million,or65.97%,over2012to3,092million.
Table 2.14 - Othernetnon-interestincomeof China Construction Bank
NetgainarisingfrominvestmentsecuritiesdroppedbyRMB2,141million,or60.55%,over2012toRMB1,395million.
Figure 2.10 - Othernetnon-interestincomeof China Construction Bank
Thiswasmainlyduetothesharpdecreaseingainsfromdisposalofnon-strippedinvestmentheldthroughdebt-equityswapandincomefrombondinterestratespread. Figure 2.10 indicate income increasesof China Construction Bank. OthernetoperatingincomeincreasedbyRMB2,194million,or21.54%,over2012,toRMB12,380million.This was mainly due tothe increase of insurance businessincome of CCB Lifeand exchange earnings. The combination of consumer surplus and producer surplus obtained by buyers and sellers when engaging in a market exchange. Gains from trade arise because buyers are typically willing and able to pay a higher price to purchase a good than what they end up paying and because sellers are typically willing and able to accept a lower price to sell a good than what they end up receiving. Both sides of the market exchange are thus better off, have a net gain in welfare, by making the trade. While all types of market exchanges generate gains from trade, this topic is perhaps most important for an understanding of international trade. Net trading gain was 1,863 million, an increase of 1,475 million, or 380.15%, over the previous year (Table 2.15). This was mainly due to the increase in the realised income from derivatives and the decrease of revaluation losses of financial assets at fair value through profit or loss.
Table 2.15 – Net trading gain of China Construction Bank
Fortheyearended31December2013,tradinggainrelatedtofinancialassetsdesignatedatfairvaluethroughprofitorloss oftheGroupamounted to4,461million(2012: loss203million).Trading gainrelatedtofinancialliabilities designatedatfairvaluethroughprofitorlossoftheGroupamountedto3,630million(2012:gain1,680million). An operatingexpense, operating expenditure, operational expense, operational expenditure is an ongoing cost for running a product, business, or system. Its counterpart, a capital expenditure ,is the cost of developing or providing non-consumable parts for the product or system. For example, the purchase of a photocopier involves capital expenditure, and the annual paper, toner, power and maintenance costs represents operating expense. For larger systems like businesses, operatingexpense may also include the cost of workers and facility expenses such as rent and utilities. In business, an operating expense is a day-to-day expense such as sales and administration, or research & development, as opposed to production, costs, and pricing. In short, this is the money the business spends in order to turn inventory into throughput. On an income statement, "operating expenses" is the sum of a business's operating expenses for a period of time, such as a month or year.In throughput accounting, the cost accounting aspect of the theory of constraints ,operating expense is the money spent turninginventory into throughput.
Date: 2015-02-16; view: 836
|