CATEGORIES:
BiologyChemistryConstructionCultureEcologyEconomyElectronicsFinanceGeographyHistoryInformaticsLawMathematicsMechanicsMedicineOtherPedagogyPhilosophyPhysicsPolicyPsychologySociologySportTourism
ANALYSIS OF THE EFFECTIVENESS OFRISKMANAGEMENTIN 10 TOPBANKS
2.1 Basic financial review of activity results China construction bank
The banking industry experienced a strong recovery after the worst of the financial crisis, but continued to be weighed down due to the ongoing Eurozone crisis and concerns ofsluggish growth in the United States. An evolving banking landscape in emerging economies (especially China and Latin America) is expected to transform the banking industry in the future. Meanwhile , regulations continue to evolve and create an ever-tightening regulatory environment for the banking industry. Many information resources provide information about the 10 strongest banks in the world.Table 2.1 shows the top 10 banks in the opinion of Capgemini Company.
Table 2.1 – Top 10 banks in the world in terms of pre-tax profit
Assets of the Top 10 banks globally grew by 4,9 % in 2012 and registered a growth across all regions in 2012, except in Europe where asset growth was down 0.5% due to concerns about Eurozone debt. The Latin America region registeredan impressive growth of 20.5% in assets in 2012, as compared to the other global regions. This resurgence of the economies in the region was driven primarily by rising consumerism and financial inclusion. Pre-tax profitability of the banking sector has witnessed a moderate growth of 4.6% during 2011–12. This growth has been largely driven by the emerging economies while the profitability of European banks has continued to be negatively impacted due to the Eurozone crisis. For banks, top priorities include regulatory compliance, improving asset quality, enhancing customer centricity, focusing on digital convergence, and tackling competition from non-banks. Banks are therefore making business and technology investments to change their business models to comply with new regulatory requirements, enhancing capital adequacy, rolling out new channels such as social media, and leveraging customer data analytics and predictive analytics to enhance customer understanding and prevent fraud. Assets of the top banks grew across all regions in 2012, except in Europe where asset growth was slightly down by 0.5%. The Latin America region registered an impressive growth of 20.5% in 2012, as compared to the other regions. This resurgence of the economies in the region was driven primarily by rising consumerism and financial inclusion. The banking industry assets in the emerging markets of the Latin America region and Asia-Pacific grew the most in 2012, at 20.5% and 9.5%, respectively. The key reason for growth in emerging markets such as China, India, and Brazil can be attributed to financial inclusion of the “bankable” income segment. In contrast to this, while North America grew by 6.1%, during the same period Europe declined marginally by 0.5%. In terms of operational efficiency, the banking industry experienced very contrasting results. Return on assets (ROA) for top banks in Europe and Latin America declined in 2012, but improved marginally for banks in the Asia-Pacific and North America regions. Emerging market banks led the way on ROA where it remained highest for Latin America at 1.6%, followed by the Asia-Pacific region at 1.1%. The ROA for top global banks in the Latin America region decreased significantly by 25 basis points in 2012, which can be primarily attributed to the strong growth in the assets of the banks compared to profitability. On the other hand, the ROA for European banks declined by nine basis points in 2011, due to substantial losses and write-offs suffered from the impact of theEurozone crisis. This led to a decrease in the assets along with the profitability, as most banks had substantial exposure to sovereign debt held by governments. The ROA of banks in North America witnessed a marginal increase of four basis points, as the economy started recovering in 2012. ChinaConstructionBankCorporation,establishedinOctober1954andheadquartered inBeijing,isaleadinglarge-scalejointstockcommercialbankinMainlandChinawithworld-renownedreputation.TheBankwaslistedonHongKongStockExchangeinOctober2005(stockcode:939)andlistedontheShanghaiStockExchangeinSeptember2007(stockcode:601939).Attheendof2013,theBank’smarketcapitalisationreachedUS$187.8billion,ranking5thamonglistedbanksintheworld. With14,650branchesandsub-branchesinMainlandChina,theBankprovidesservicesto3,065,400corporatecustomersand291millionpersonalcustomers,andmaintains closecooperativerelationshipswithasignificantnumberofhigh-endcustomersandleadingenterprisesofstrategicindustriesintheChineseeconomy.TheBankmaintains overseasbranchesinHongKong,Singapore,Frankfurt,Johannesburg,Tokyo,Osaka,Seoul,NewYork,HoChiMinhCity,Sydney,Melbourne,TaipeiandLuxembourg,andowns varioussubsidiaries,suchasCCBAsia,CCBInternational,CCBLondon,CCB Russia,CCBDubai,CCBEurope,CCBPrincipalAssetManagement,CCBFinancialLeasing,CCBTrustandCCBLife. TheBankupholdsits“customer-centric,market-oriented”businessconcept,adherestoitsdevelopmentstrategyof“integration,multifunctionandintensiveness”,andstrivestoprovidecustomerswithpremiumandall-roundmodernfinancialservicesbyacceleratinginnovationofproducts,channelsandservicemodes.Withanumberofcorebusinessindicatorsleadingthemarket,theBankvigorouslypromotesthedevelopmentofemergingbusinessesincludingelectronicbanking,privatebanking,creditcards,cashmanagement,andpension,whilemaintainingitstraditionalbusinessesadvantages ininfrastructureandhousingfinance.TheBankconstantlyoptimisesbusinessandmanagementprocesses,andincreasesinvestmentsintheconstructionoffundamentals likeinformationsystems,aimingtoenhanceitscapabilityofriskpreventionandmarketcompetitiveness. TheBankadvocatesfulfilmentofcitizenresponsibilitiesasitscorporate missionandpro-activelycombinesbusinessdevelopmentwithundertakingofsocialresponsibilities,dedicatedtobuildingabankwithsustainabledevelopmentthatservesthegeneralpublic,improvespeople’slivelihood,promoteslowcarbonandenvironmentalprotection.ThefinancialinformationsetforthinthisannualreportispreparedonaconsolidatedbasisinaccordancewiththeIFRS,andexpressedinRMBunlessotherwisestated. In2013,theglobaleconomyappearedtobeinslowrecovery.TheU.S.economicrecoverygainedmomentumandtheeurozoneandJapaneseeconomiesshowedsignsofimprovement.Partofemergingmarketeconomiesrecordedslowergrowthandfacedincreasingrisks.AccordingtothereportpublishedbytheInternationalMonetaryFund,thegrowthrateofglobaleconomywas3.0%in2013,adecreaseof0.1percentagepointfrom2012. In2013,China’seconomymaintainedsteadygrowthonthewhole.Althoughfacedwithcomplexinternalandexternalenvironment,thefundamentalsthatsupportedthesteadygrowthofChina’seconomyhadnotchangedinessence.Economicrestructuringandreformweremakingprogress,investmentandconsumptionincreasedsteadily,structureofimportandexportwasfurtheroptimisedandemploymentremainedstable.In2013,China’sGDPwasRMB56.9trillion,up7.7%over2012,whiletheconsumerpriceindexincreasedby2.6%overthepreviousyear.In2013,China’sfinancialmarketcontinuedtogrowsmoothly.ThePBOCfurtheredthereformofinterestrateliberalisation. ThePBOCremovedthecontroloverinterestratesonloansofferedbyfinancialinstitutionstotheirclientson20July,andestablishedtheself-regulatorypricingmechanismformarketinterestratesandthecentralisedquotationandreleasemechanism for LoanPrime Rate(LPR) afterwards.The monetarycredit growthwas inline with expectations,and theloanstructurecontinuedtoimprove.Attheendof2013,theoutstandingbroadmoneysupplyM2increasedby13.6%overthepreviousyeartoRMB110.7trillion,andthenarrowmoneysupplyM1increasedby9.3%toRMB33.7trillion.TheamountofloansgrantedinRMBincreasedby14.1%toRMB71.9trillion.DepositsinRMBincreasedby13.8%over2012toRMB104.4 trillion. In2014,theglobaleconomicenvironmentwillstillbesubjecttovariablesandrisks,andthegrowthindomesticeconomywillbe facedwithmultiple testsincludingshiftingof growthrateandstructure adjustment. Asthefinancing structure,capitaluse,interestrateandexchangerateofthe wholesocietyareexperiencing deeperandquickerchanges,theGroupwill befacedwithunprecedented challenges in consolidatingthe operating results.Adhering to thedevelopment strategy featuring“integration,multifunctionandintensiveness”,the Groupwillaccelerate thedevelopmentof innovationandstrategic transformation,continuetofullysupportandservetherealeconomy,sticktosounddevelopmentandstringentlyholdthebottomlineinpreventingrisks, therebyconstantlyendeavouringtoenhanceitscapabilityinvaluecreation. In 2013, the Group’s incometax expense reached 64,684million, an increase of6,847 million over 2012.Theeffectiveincometaxratewas23.12%,lowerthanthe25%statutoryrate,largelybecausetheinterestincomefromthePRCgovernmentbondsheldbytheGroupwasnon-taxableinaccordancewithtaxregulations. The table 2.2 and figure 2.1setsforththecompositionoftheGroup’simpairmentlossesduringrespectiveperiods.
Table 2.2 -ThecompositionoftheGroup’simpairmentlosses
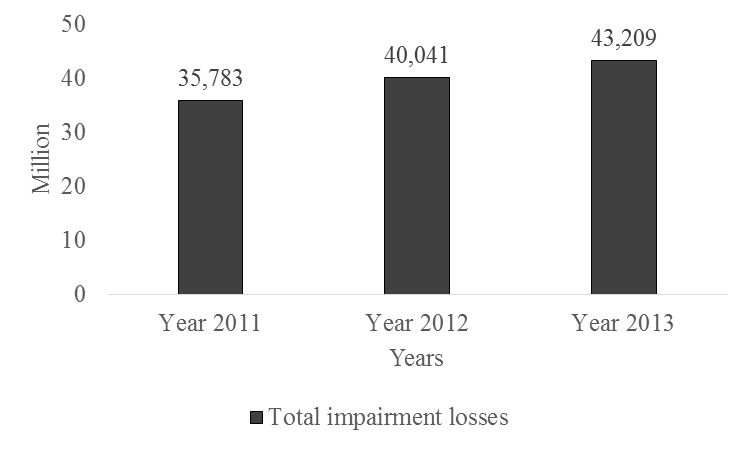
In2013,theGroup’simpairmentlosseswere43,209million,anincreaseof3,168million,or7.91%,over2012.Inthisamount,impairmentlossesonloansandadvancestocustomerswere42,666million,anincreaseof4,336million,or11.31%,over2012.Reversalofimpairmentlossesoninvestmentswas130million,adecreaseof1,426million,or110.03%,over2012.
Figure 2.1 - ThecompositionoftheGroup’simpairmentlosses
The large global banks typically offer all three services, with smaller banks usually focusing more on the investment banking division side covering advisory and mergers and acquisitions (M&A).Table 2.3and figure 2.2reports about the effectiveness of investment activity China Construction Bank.
Table 2.3 - ThecompositionoftheGroup’sinvestments
In2013,inaccordancewithitsannualinvestmentandtradingstrategyandriskpolicyrequirements,theGroupproactivelydealtwithregulatoryandmarketchangestoachievethebalancebetweenrisksandreturns.Asat31December2013,theGroup’sinvestmentstotalled3,414,617million,anincreaseof547,969million,or19.12%over2012.
Figure 2.2 - ThecompositionoftheGroup’sinvestments
Inthisamount,debtsecuritiesinvestmentsaccountedfor91.25%oftotalinvestments,adecreaseof8.08percentagepointsover2012.Other debtinstrumentsaccountedfor8.16%oftotalinvestments,whichwerefinancialassetsdesignatedatfairvaluethroughprofitorlossarisingfrominvestmentsindepositswithbanksandnon-bankfinancialinstitutionsofpartofnewlyissuedprincipal-guaranteedwealthmanagementproducts. A deposit account is a savings account, current account, or other type of bank account, at a banking institution that allows money to be deposited and withdrawn by the account holder. These transactions are recorded on the bank's books, and the resulting balance is recorded as a liability for the bank and represents the amount owed by the bank to the customer. Some banks may charge a fee for this service, while others may pay the customer interest on the funds deposited.Customer deposits have great influence on the activities of banks in general (Table 2.4)
Table 2.4 - Depositsfromcustomersbyproducttype in China Construction Bank
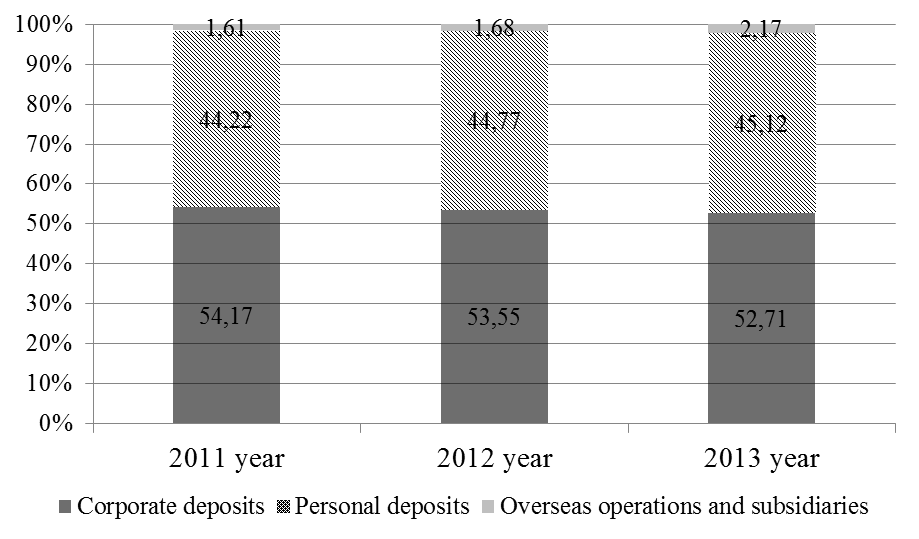
For a more precise analysis of these changes show in the Figure 2.3. Asat31December2013,theGroup’stotaldepositsfromcustomersreached12,223,037million,anincreaseof879,958million,or7.76%over2012.Inthisamount,domesticdemanddepositsoftheBankincreasedby767,144 million,or13.21%,higherthanthe0.73%growthoftimedeposits. TheGroup’soff-balancesheetitemsincludederivatives,commitmentsandcontingentliabilities.
Figure 2.3 - Depositsfromcustomersbyproducttype in China Construction Bank
Derivativesincludeinterestratecontracts,exchangeratecontracts,preciousmetalcontracts,andequityinstrumentcontracts.PleaserefertoNote“Derivatives”inthe“FinancialStatements”ofthisannualreportfordetailsonthenominalamountsandfairvalueofderivatives.Commitmentsandcontingentliabilitiesincludecreditcommitments,operatingleasecommitments,capitalcommitments,underwritingobligations,redemptionobligations,outstandinglitigationanddisputes.TheGroupenhanced therefinedmanagementoveroff-balancesheetactivitiesandcontinuedtoadvancetheadjustmentstooff-balancesheetstructure.Amongthese,creditcommitmentswerethelargestcomponent,withabalanceof2,310,227millionasat31 December2013,anincreaseof293,928millionover2012.PleaserefertoNote“CommitmentsandContingentLiabilities”inthe“FinancialStatements”ofthisannualreportfordetailsoncommitmentsandcontingentliabilities.
Date: 2015-02-16; view: 1053
|