CATEGORIES:
BiologyChemistryConstructionCultureEcologyEconomyElectronicsFinanceGeographyHistoryInformaticsLawMathematicsMechanicsMedicineOtherPedagogyPhilosophyPhysicsPolicyPsychologySociologySportTourism
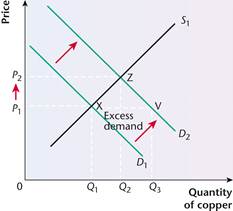
Topic 2 The allocation of resources in competitive markets1 A downward-sloping demand curve shows an inverse relationship between planned quantity demanded and the price of a good or service. (2 marks) 2 The total amount of a good or service which firms are willing to sell in the marketplace in a given time period. (2 marks) 3 Market equilibrium is when the forces of supply and demand are balanced. This occurs when planned demand is equal to planned supply. (3 marks) 4 A shift in demand occurs following a change in at least one of the conditions of demand, in which case the ceteris paribus assumption no longer holds. The demand curve shifts to a new position, sliding along the supply curve. An adjustment along the supply curve happens when the price of the good or service changes. In the following diagram, the demand curve shifts from D1 to D2, and at the new equilibrium at point Z, supply has adjusted from Q1 to Q2. Essentially, an increase in demand leads to an expansion of supply. (4 marks)
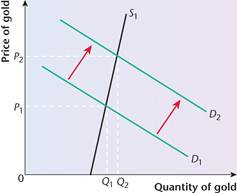
The diagram above, which develops Figure 1 on p. 10 in the workbook, can be used to show excess demand. Immediately after the shift of the demand curve from D1 to D2 shown in the diagram, quantity Q3 is demanded at price P1. However, at this price, firms are only willing to supply Q1. Excess demand at this price is shown by the distance between points X and V (or between Q1 and Q3). This excess demand causes the price to rise until a new equilibrium is reached at point Z and price P2. 6 The term refers to how scarce resources are allocated between competing uses. In the marketplace resources are allocated by the price mechanism which is guided by the forces of supply and demand. 7 The shift in demand was driven by speculators entering the market seeking to buy copper at a low price and sell it at a later date at a higher price, with the aim of making a considerable profit. The speculative demand increased the price of copper because of two factors that limited supply. First, stockpiles of copper were very low; second, it was difficult for new copper to be mined. This meant that the supply of copper was inelastic with respect to a price increase and thus unresponsive to the increased surge in demand. (6 marks) 8 A rapid increase in the price of copper will mean higher prices for consumers which in turn will mean that they will purchase less. Also, the higher cost of production of goods made in part from copper feeds into the general inflation figures for the economy. Higher prices will affect households negatively because they will have to pay more for goods, thus having less disposable income for other purchases. However, copper mining companies should experience higher sales revenue if demand for copper is price inelastic. The significant long-term effect of the higher price of copper will be to send a signal to the markets that copper is now an even more valuable good. This will create greater incentives for producers to increase supply in the long run. Mining companies will seek new sources of copper. Scrap metal merchants will seek to recover greater quantities of recycled copper. The high price should also create incentives for consumers to use copper more sparingly and search for alternative raw materials, e.g. plastic piping. This could cause prices to fall eventually. Additionally, a very serious cost of the high price of copper is an increase in crime, with criminal gangs stealing copper in order to sell it to scrap metal traders. This is exceptionally dangerous when it puts public safety in danger if for example railway signal wires are stolen. (10 marks) 9 Elasticity measures the responsiveness of a dependent variable following a change in an independent variable. PED measures the percentage change in the quantity demanded for a good following the change in the price. PES measures how the quantity supplied to a market responds proportionately to a change in price. (4 marks) 10 Price elasticity of demand = Percentage change in quantity demanded Percentage change in price Income elasticity of demand = Percentage change in quantity demanded Percentage change in income (4 marks) 11 The supply curve for new houses is inelastic for three main reasons. First, there are strict planning laws in the UK which prevent house builders from quickly increasing the supply of houses. Second, there is a shortage of available land to build on. The UK has a large population relative to its land mass. Third, it takes months, if not years, to build a house. (5 marks) 12 In the UK, most people finance house purchase using borrowed money (a mortgage). Low interest rates create an incentive to take out mortgages to buy houses. In 2012, interest repayments were cheap and low interest rates create a disincentive to save because of the low return on savings. However, demand for houses actually fell because although consumers wanted to borrow to finance house purchase, the banks and building societies reduced the supply of mortgages to minimise risks following the huge losses they had incurred in earlier years during the banking crisis. As a result, demand decreased because the number of consumers who could obtain mortgages to buy property fell, since they were unable to borrow sufficient funds to finance house purchase. (8 marks) Answers to exam-style questions (data response) 01 Speculation is the act of buying a product or asset with the aim of selling it at a later date so as to make a profit from the difference between the buying and selling prices. (5 out of 5 marks) Part 01 questions require a short snappy (but accurate) definition. The candidate has provided a good definition. 02 First, between October 2010 and September 2011 the price of gold increased. At the start of the period the price was approximately $1,375 per ounce but by the end of the period it had increased to roughly $1,680 per ounce. Second, the price of gold rapidly increased between the end of June 2011 and the end of August 2011. It rose from $1,500 per ounce to just under $2,000 per ounce. This was a price increase of 30% in When Extract A in a question contains just one data series (in this case, changes in the price of gold over several months), the question will ask for an identification of two significant features of the data. It is a good idea to write these in two separate paragraphs.
Gold is a precious metal and an extremely scarce resource. The price of gold increased in 2009 for three main reasons. First, the supply of gold was inelastic (see supply curve on the diagram) and could not respond to the increases in demand. As Extract B states: ‘only a small amount of new gold can be mined each year’. Second, demand increased dramatically, as shown by the shift of the demand curve from D1 to D2 in the diagram. The shift occurred as a result of economic uncertainty, which caused many investors to buy gold. Gold is a physical asset rather than a financial asset and ‘is regarded as a safe haven’ (Extract B, line 10) in uncertain times. The shift of the demand cause was also caused by speculators entering the market in the hope of making a profit from selling later at a higher price. The key instruction in a part 03 question is always ‘explain’. This requires application of some relevant economic theory, for example supply and demand theory, to address the issue or issues posed by the question. 04 The regional economy in the Scottish Highlands could benefit significantly from the opening of new gold mines. The mine owners should be able to make significant profits as long as the price of gold remains high. They would be able to sell their gold on the world markets and generate revenues which they could in turn use to purchase assets, capital goods and consumer goods. They would also need to employ workers to operate the mines. This would be a valuable boost to local levels of employment. Furthermore, the wages paid would invariably be spent in the local economy and local businesses would thrive. This should result in higher growth and living standards in Scotland. The gold mines would also increase the overall supply of gold on the global markets which might calm commodity markets and reduce feverish speculation. These are the possible benefits for the Scottish economy and the wider UK and global economies. However, the opening of new mines would also impose significant costs on the local environment. Gold mining has many dirty side effects and would result in pollution being dumped into local rivers and springs. This is unavoidable, and as Extract C, line 8, states, it would ‘affect adversely the quality of drinking water in Scottish cities’. This is extremely worrying because it would have an effect on public health, although by contrast high levels of unemployment can also have a significant effect on the mental health of a community. The mining process would create ‘eyesores’ and it may harm an area of outstanding natural beauty. This is a powerful argument because although economic growth and employment are important it is also the duty of government to preserve the environment for future generations. This is a difficult trade-off: economic growth versus environmental preservation. Ultimately the decision to open new gold mines is desirable because growth and employment are much needed but it should only go ahead if the extent of environmental damage is limited and any change in the quality of drinking water will have no significant effects on public health. Finally, if the price of gold were to fall on the world gold market, the high-cost Scottish mines might become uneconomic and have to close. ‘Eyesore’ pollution would continue, but derelict mines would no longer produce any benefits for the Scottish economy. In the long run, whether the benefits of Scottish mining exceed the costs depends in large part on the future viability of mines if world demand and supply conditions for gold change. (16 out of 25 marks) This answer has been awarded a mark at the top of Level 3 in the AQA mark scheme. The Levels descriptors in the mark scheme are used for all part 04 and 08 Context data response questions at AS). The Level 3 descriptor is:
Although there is evaluation in the answer, good evaluation must first be preceded by focused analysis. Date: 2015-02-03; view: 903
|